A digital twin based on Land Administration 🔗
Description
A digital twin can be defined as a digital representation of a physical asset, its related processes, systems and information, including physical assets indoors, outdoors, above and below ground. Digital twins combine state-of-the-art engineering models and analytics with asset specific operational data to create digital simulation models and information models that are updated and changed throughout the lifecycle of their physical counterparts. A Digital Twin provides a scope for efficient information management and multidisciplinary collaborations for different decision-making objectives in a built environment.
The digital twin is a concept that will enhance information management and collaboration, where experts can work together, preventing costly mistakes and rework. It is important to state that a Digital Twin also encompasses 4D, the time; thus, maintaining date and time attributes.
An MSc thesis topic could focus on the creation of the digital twin of a use case area (i.e. 3D models in differentLoDs ), including key design and condition information for physical assets above and below ground, plus legal boundaries to better manage current and future developments. Complex digital information about the area's infrastructure will be modelled according to international standards (ISO, OGC, industry standards, etc.) and visualised using 3D web-viewers (e.g. Cesium, etc.). One of the objectives could be to outline strategies and methodologies to link the virtual and legal (real) Rights, Restrictions and Responsibilities (RRRs), land use, etc.
Related literature :
- http://ggim.un.org/unwgic/presentations/3.5-JOHN-KEDAR.pdf
- https://www.nationaltribune.com.au/fishermans-bend-digital-twin-to-modernise-sustainable-urban-planning-for-victoria/
- https://www.itnews.com.au/news/nsw-govt-offers-first-look-at-its-digital-twin-518860
- Schleich, B.; Anwer, N.; Mathieu, L.; Wartzack, S. (2017). Shaping the digital twin for design and production engineering. CIRP Annals - Manufacturing Technology 66 (2017), 141--144.
- Grieves, M. and Vickers, J. (2017). Digital Twin: Mitigating Unpredictable, Undesirable Emergent Behavior in Complex Systems. In: Transdisciplinary Perspectives on Complex Systems: New Findings and Approaches, Springer International Publishing 2017, pp. 85--113.
Contacts
- Eftychia Kalogianni ( e-mail · staff page )
- Peter van Oosterom ( e-mail · staff page )
Keywords
Digital Twins
A model-based approach for layout reconfiguration from indoor point clouds 🔗
Description
Source: https://www.pinterest.com/pin/233905774372839617/
Layout problems range in scale from urban planning by the assignment of activities to cities, sites, or buildings, to the location of equipment and personnel on a single floor, or even to the location of components in printed circuit boards. Reconfiguring existing indoor spaces is also typically addressed in interior design and building renovation.
This MSc thesis will focus on the development of a method for the automatic layout reconfiguration of indoor scenes from point clouds. For this purpose, model-driven approaches will be explored to introduce rules aiming to automatically reconfigure the position of building objects according to their function. Point clouds captured with Apple Smart Devices will be explored as data source.
Required skills: Proficient in Python programming
Contacts
- Edward Verbree ( e-mail · staff page )
- Lucía Díaz Vilariño ( e-mail )
Keywords
Point clouds
Advancing Aerial Imagery: Resolution Enhancement and Feature-Aware Detection (at Readar) 🔗
Description
These 2 topics will be hosted by Readar. Readar is a small high tech company focusing on aerial image analysis. We will provide you with technical help and know-how, all necessary training data and compute resources. We require you to be at our office in Utrecht for at least 1 day a week (more is even better!). Our goal is to provide you with everything to succeed in a successful internship, scientific valid research and results that allow us to improve our image analysis pipeline.
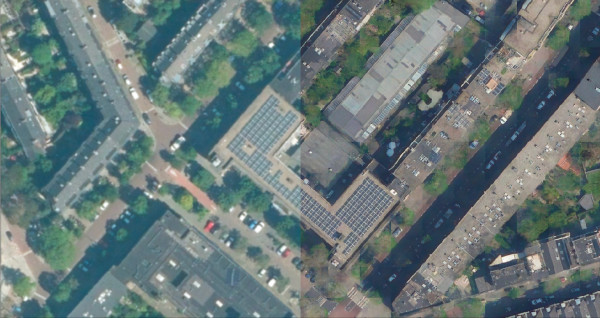
Thesis topic: Super-resolution of aerial imagery
What you can see and detect in aerial imagery is limited by the ground resolution (GSD) of the imagery. Higher resolution is however much more costly as the aircraft has to fly lower and take more images to achieve the same coverage. Novel techniques in computer vision allow us to artificially enhance the resolution of imagery. This does by definition does not add information, but makes the image look like higher resolution imagery. Especially man made features such as buildings, roads and solar panels have clearly defined shapes which allow us to artificially enhance the resolution of imagery. In our first analysis it is shown that this is not only pleasant for humans, but also improves the performance of deep learning methods that extract information from the imagery.
In this research we will aim to synthetically increase the resolution of aerial imagery. In previous work this methodology showed to improve the performance of downstream tasks such as building and solar panel detection. Within the previous work a relatively old foundation network was trained to create a proof of concept. As this ground-work has done, you will now build a state-of-the-art implementation.
Thesis topic: Fusion of vision based and feature based classification
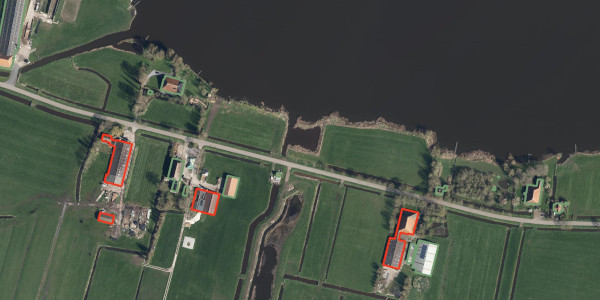
In this topic you will work on new methods to help remove asbestos roofs in the Netherlands. Asbestos roofs have been installed until 1994. Due to their age these roofs are slowly disintegrating, releasing hazardous asbestos fibre into the open. Inhaling these fibers causes long cancer. By knowing the location of these roofs, the government can take action to persuade building owners to remove them.
At Readar we have broad experience in detecting asbestos roofs in aerial imagery. From the data we know that text features we can extract from other datasets such as the building use type from the BAG give a very strong indication on whether a roof is suspicious. Within this research you will extend our existing vision based classification model to ingest text based information. In the research you will look into different methods to do so.
Contacts
- Sven Briels ( e-mail )
- Azarakhsh Rafiee ( e-mail · staff page )
Keywords
Artificial Intelligence, Imagery
AI-based Point-Cloud Augmentation and Densification for mesh-free wind simulations 🔗
Description
Computational Fluid Dynamics (CFD) is an important tool for the analysis and optimization of urban environments. It can help identify and prevent urban geometries that cause excessive wind speeds, poor pedestrian comfort, or limit the dispersion of airborne pollutants. Traditionally, CFD simulations are performed on a mesh: a collection of finite cells that discretize the simulation domain. However, generating high-quality meshes for complex urban geometries is often cumbersome, time-consuming, and computationally expensive. A promising alternative is to perform CFD simulations directly on a finite set of points. This meshfree approach is particularly suitable for large-scale urban wind simulations, where detailed geometry and large spatial domains make conventional mesh generation challenging. By using urban point clouds, such as the Dutch AHN dataset, directly as boundary representations, meshfree methods could significantly accelerate the simulation workflow and contribute toward near real-time urban wind simulations.
However, raw point clouds are often unsuitable for numerical simulation due to non-uniform density, anisotropic sampling, noise, and incomplete geometry. This thesis focuses on investigating and implementing point-cloud augmentation techniques to improve the quality of urban point clouds for meshfree CFD applications. Particular attention is given to point-cloud densification and the correction of anisotropic point distributions, potentially using deep-learning-based approaches. Different methodologies should be investigated and evaluated with respect to geometric fidelity, computational efficiency, and robustness in the context of urban wind simulations.
Related Literature:
- Suchde, P., Jacquemin, T., & Davydov, O. (2023). Point Cloud Generation for Meshfree Methods: An Overview: Pratik Suchde et al. Archives of Computational Methods in Engineering, 30(2), 889-915.
- Zhang, T., & Barakos, G. N. (2025). SDF‐Guided Point Cloud Generation Framework for Mesh‐Free CFD. International Journal for Numerical Methods in Fluids, 97(7), 1035-1056.
Contacts
- Azarakhsh Rafiee ( e-mail · staff page )
- Ákos Sárkány ( e-mail )
Keywords
Computational Fluid Dynamics, Point clouds
Air Rights Restrictions and Responsibilities: investigate, model, and visualise them in the context of ISO 19152 LADM 🔗
Description
The fact that a 3D property unit must comprise a building or other facility or a part of it, does not mean that the property unit has to be developed when it is formed. During a transition period, property units that consist of airspace or unused space below ground can be permitted, bought, sold, etc. Air-space parcels are 3D parcels created vertically and horizontally within a building to establish separate legally transferable lots. This means that there is need to investigate the types and modelling approaches of air Rights, Restrictions and Responsibilities attached to those spaces as well as their visualisation, as they also contribute much of the value of the spatial unit. This procedure is subject to the legislative framework and regulations of each country and limited by local building codes, ordinances, and zoning restrictions. The last years, the spatial management of complex urban environment is asking for 3D registration and representation of Rights, Restrictions and Responsibilities (RRRs). The first edition of the ISO 19152 Land Administration Domain Model (LADM), one of the first spatial domain standards, providing a flexible conceptual schema as basis for the development of 2D and 3D cadastres based on a Model Driven Architecture (MDA) (ISO 19152, 2012), allows for all those levels of complexity (2D, 3D, as well as integrated 2D and 3D spatial units) with various levels of accuracy. Currently, the standard is under revision, and it is a good opportunity to initiate the discussion on the registration of air-parcels. Objective: This MSc thesis could focus on the modelling of 3D air-space parcels, in the context of LADM revision and explore visualisation options.
Related literature :
- https://www.nytimes.com/2019/07/22/nyregion/manhattan-real-estate-views-air-rights.html?smid=tw-nytimes&smtyp=cur
- https://www.crainscleveland.com/article/20150126/BLOGS05/150129866/air-right-parcels-an-alternate-way-to-structure-mixed-use
- ISO (2012). ISO 19152:2012. Geographic information -- Land Administration Domain Model (LADM). International Organization for Standardization (ISO). Geneva, Switzerland. https://www.iso.org/standard/51206.html .
- Barbara Cemellini (2018). Web-based visualization of 3D cadastre, Master's thesis, Geomatics, Delft University of Technology.
- Eftychia Kalogianni, Efi Dimopoulou, Rod Thompson, Christiaan Lemmen, Peter van Oosterom. Investigating 3D spatial unit's as basis for refined 3D spatial profiles in the context of LADM revision, In: Proceedings of the 6th International Workshop on 3D Cadastres (Peter van Oosterom, Dirk Dubbeling, eds.), Delft, pp. 177-199, 2018.
Contacts
- Eftychia Kalogianni ( e-mail · staff page )
- Peter van Oosterom ( e-mail · staff page )
Keywords
Land Administration
Air temperature estimation through thermal satellite imagery 🔗
Description
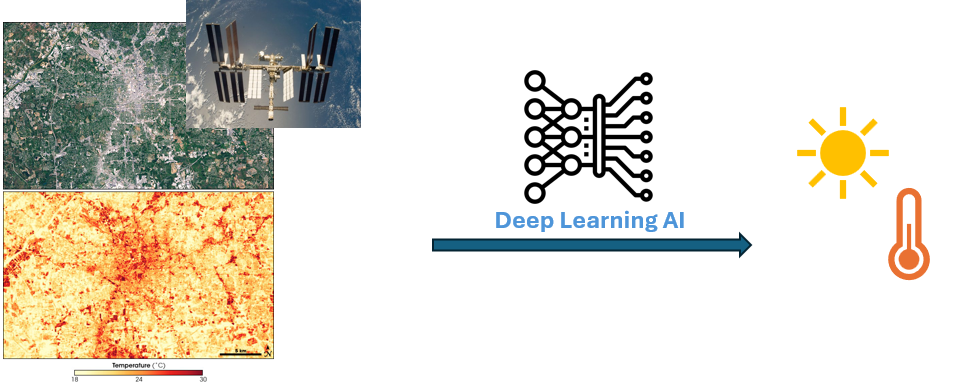
Estimating air temperature is crucial for environmental analyses as it influences a wide range of natural processes, including weather patterns, ecosystem behavior, and plant growth. Among others, understanding air temperature and its pattern is especially important for assessing heat stress. Prolonged exposure to high temperatures can lead to serious health risks, including heat exhaustion and heatstroke. In urban areas, where the heat island effect amplifies temperatures, accurate estimates are critical for designing public health interventions and cooling strategies. reliable temperature estimates support informed decisions to reduce heat-related risks and build resilience in both natural and human systems.
Using thermal satellite imagery for air temperature estimation provides wide-area coverage, allowing researchers to monitor temperature patterns across large and remote regions that may lack ground-based sensors. Thermal imagery captures surface temperature, enabling detailed analysis of urban heat islands, agricultural fields, and natural ecosystems. It also supports continuous, long-term monitoring, which is essential for detecting trends, assessing climate change impacts, and responding to extreme heat events. However, estimating air temperature from thermal satellite imagery, specifically Land Surface Temperature (LST), presents several challenges. LST represents the temperature of the Earth's surface, which can differ significantly from the air temperature measured at standard meteorological heights (typically 2 meters above ground). Factors such as surface type, vegetation cover, time of day, and atmospheric conditions can cause these differences. Converting LST to accurate air temperature requires accounting for these variables to ensure reliable estimates. Spatio-temporal deep learning models, such as convolutional LSTMs or attention-based networks, can capture both spatial dependencies and temporal dynamics in satellite and environmental data, enabling more accurate and context-aware conversion of LST to air temperature over time and across different regions.
This research topic focuses on the development of a spatio-temporal deep learning model for converting Land Surface Temperature (LST) to air temperature by modeling the complex, non-linear relationships between satellite-derived data and ground-based temperature measurements. The model can incorporate additional inputs such as vegetation indices, elevation, land cover, and meteorological variables to improve accuracy.
Contacts
- Azarakhsh Rafiee ( e-mail · staff page )
Keywords
Artificial Intelligence, Imagery
Airborne LiDAR processing methods for indoor wireframe reconstruction 🔗
Description
Point clouds from airborne laser scanners are remarkably different from those acquired with indoor mobile laser scanners, or perhaps not so much? This work seeks to explore a wireframe reconstruction method designed and trained with LiDAR ALS data to point clouds acquired with an HMLS. Through room isolation and geometric adaptation algorithms, each HMLS room will be considered as a ALS building to be processed.
References:
Akwensi, P. H., Bharadwaj, A., & Wang, R. (2025). Points2Model: a neural-guided 3D building wireframe reconstruction from airborne LiDAR point clouds. International Journal of Digital Earth, 18(1), 2458682. https://doi.org/10.1080/17538947.2025.2458682

Contacts
- Jesús Balado Frías ( e-mail )
- Edward Verbree ( e-mail · staff page )
Keywords
Artificial Intelligence, Point clouds
Allmaps - Curating, georeferencing and exploring digitized maps 🔗
Description

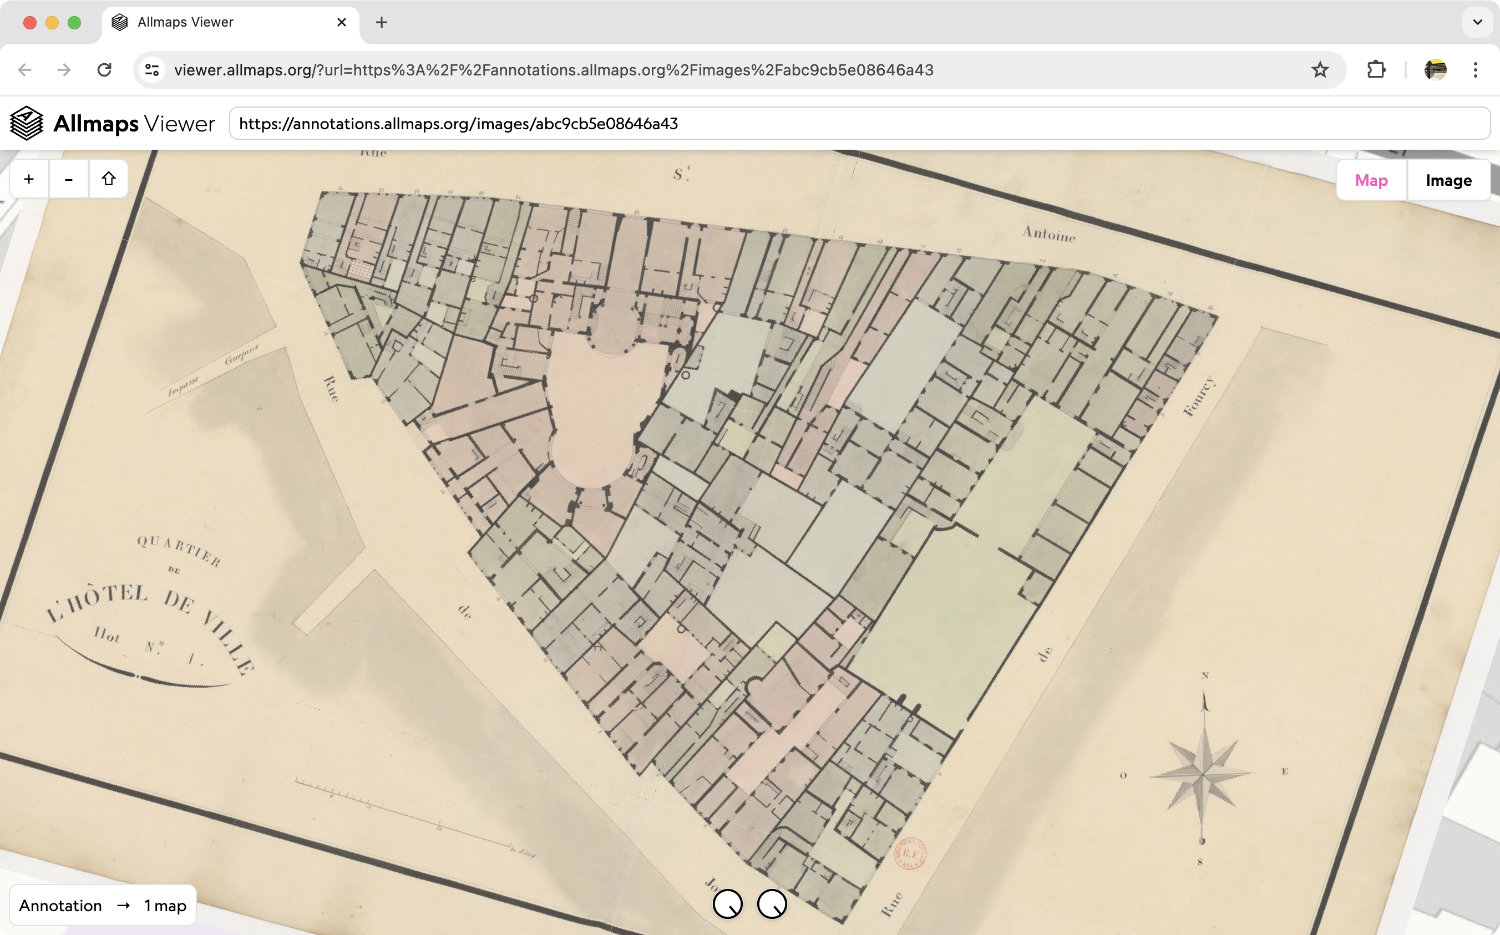
Introduction: Allmaps is an innovative open-source ecosystem dedicated to curating, georeferencing, and exploring digitized maps. It leverages the standards of the International Image Interoperability Framework (IIIF) used by a large number of cultural heritage institutions worldwide to present their digital collections. By offering accessible web-based interfaces, Allmaps introduces GIS to new audiences while retaining compatibility with traditional methods. Together with an international consortium of institutions, TU Delft Library supports Allmaps’ development with the aim to make digital collections more usable for research and education.
Potential thesis topics can contribute to the project by:
- increasing the number of available maps by developing and improving workflows for automated georeferencing of large collections;
- making more information about historical maps available as Linked Open Data by extending the underlying data model;
- increasing compatibility with existing GIS workflows and machine learning pipelines by developing integrations;
- expanding use cases (preferably in the field of architecture and urban design) by prototyping new applications and/or modules while testing UX solutions.
NB: Allmaps consists of a series of Javascript packages, Svelte applications, a PostGIS database and a Command Line Interface. While projects making use of Python or other programming languages are not discouraged, they might benefit less from the available modules and cannot directly contribute to the codebase in the form of pull requests.
Below is a list of concrete suggestions for thesis topics; feel free however to get in touch to suggest your own.
Thesis Topic: An Interactive Trade Directory of 19th Century Paris
The first part of the research will focus on georeferencing digitized cadastral maps of Paris from the early 19th century held by the Bibliothèque nationale de France (BnF). For this, image segmentation and existing shapefiles of each building block will be used. The second part involves relating the georeferenced maps to data extracted and enriched from 19th-century trade directories by the SODUCO project. This enables the identification and analysis of specific businesses and their corresponding building plans.
Links:
- SODUCO
- Grand plan cadastral de la ville de Paris (BnF)
- Example of a single sheet georeferenced with Allmaps
- Existing interface with non-IIIF maps
- Shapefiles of the different building blocks and parcels
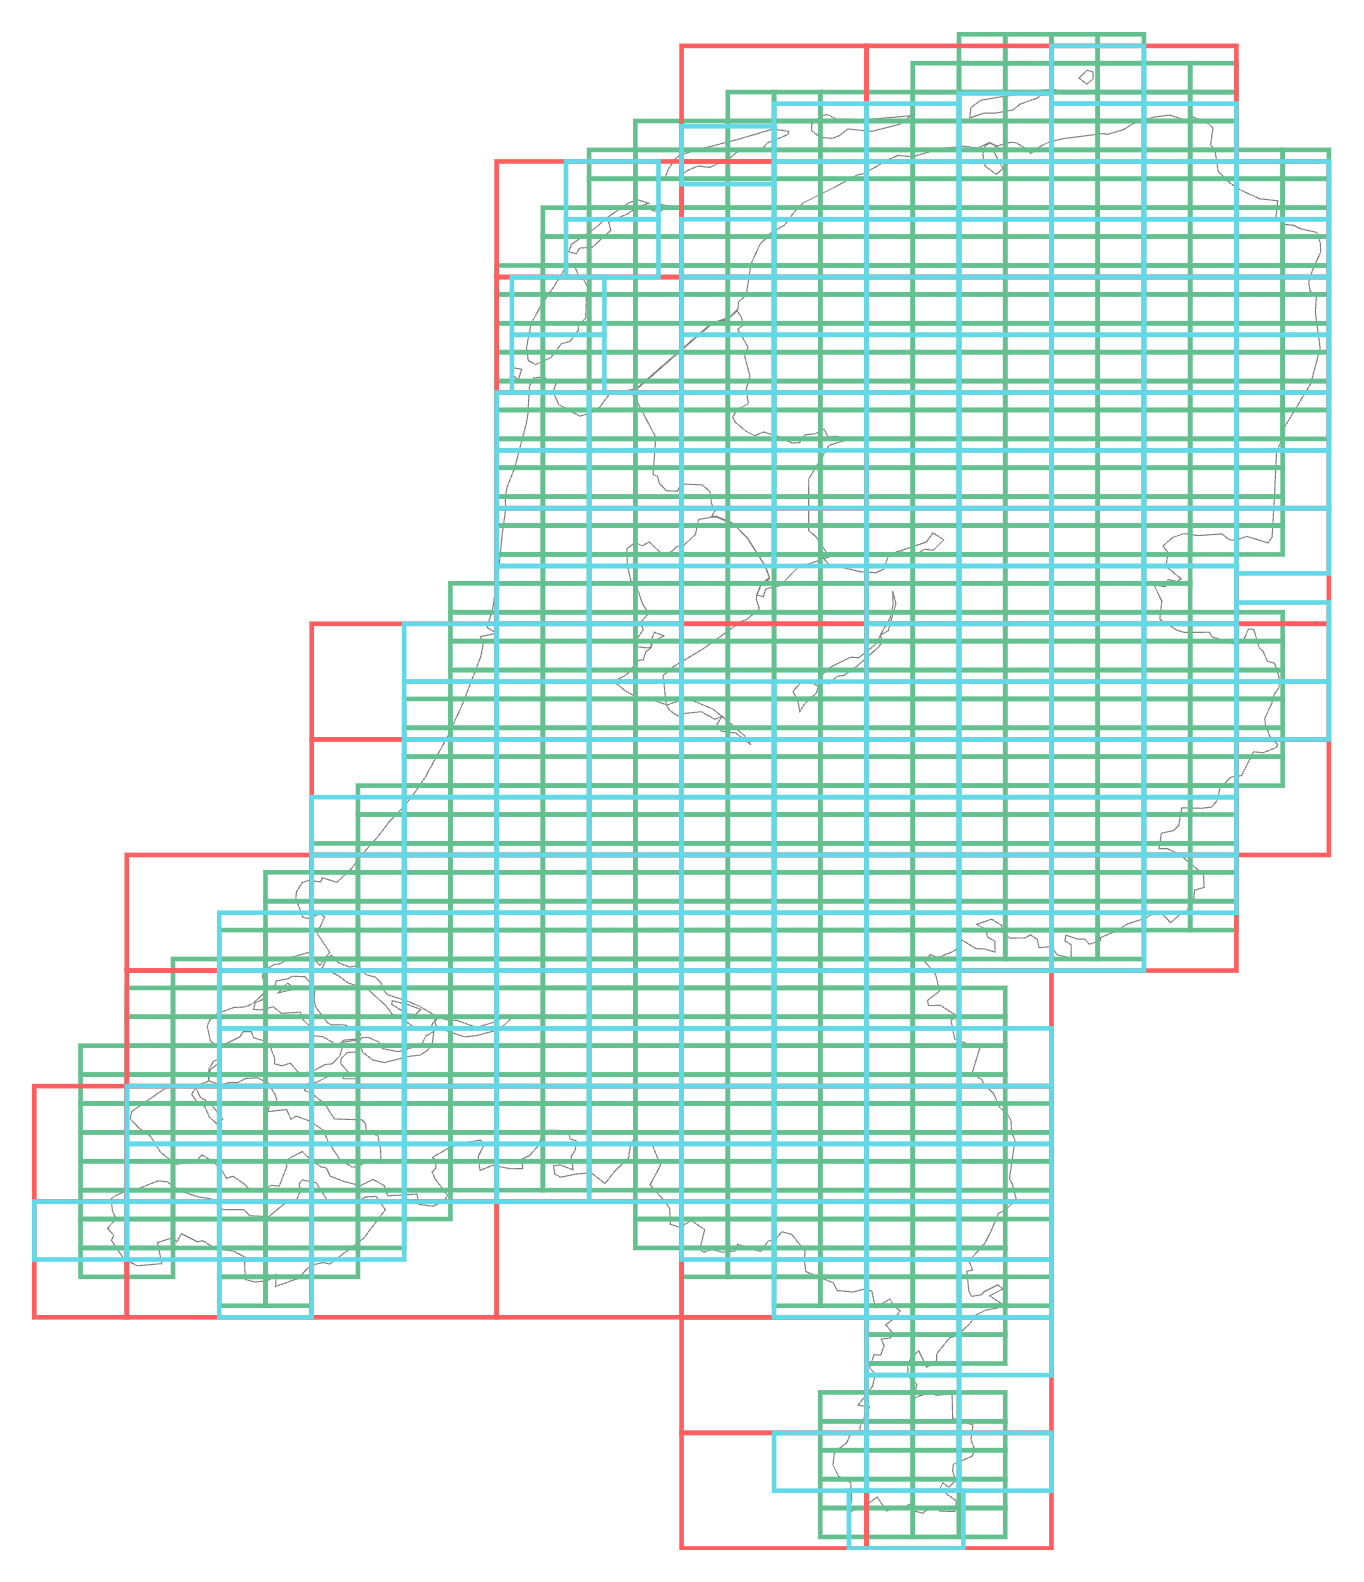
Thesis Topic: Modeling and Metadata Description of Map Series
This topic will focus on developing a shared metadata model for historical map series, taking into account different (sub)series, editions and individual sheets, their logic and exceptions. The aim is to standardize this information using Linked Open Data principles. The second part involves applying the developed model to enrich the metadata of existing digital editions, spread over multiple institutions, to demonstrate its effectiveness and applicability.
Links:
- Sheet indices of Dutch map series
- Digitized topographical map series (Nationaal Archief)
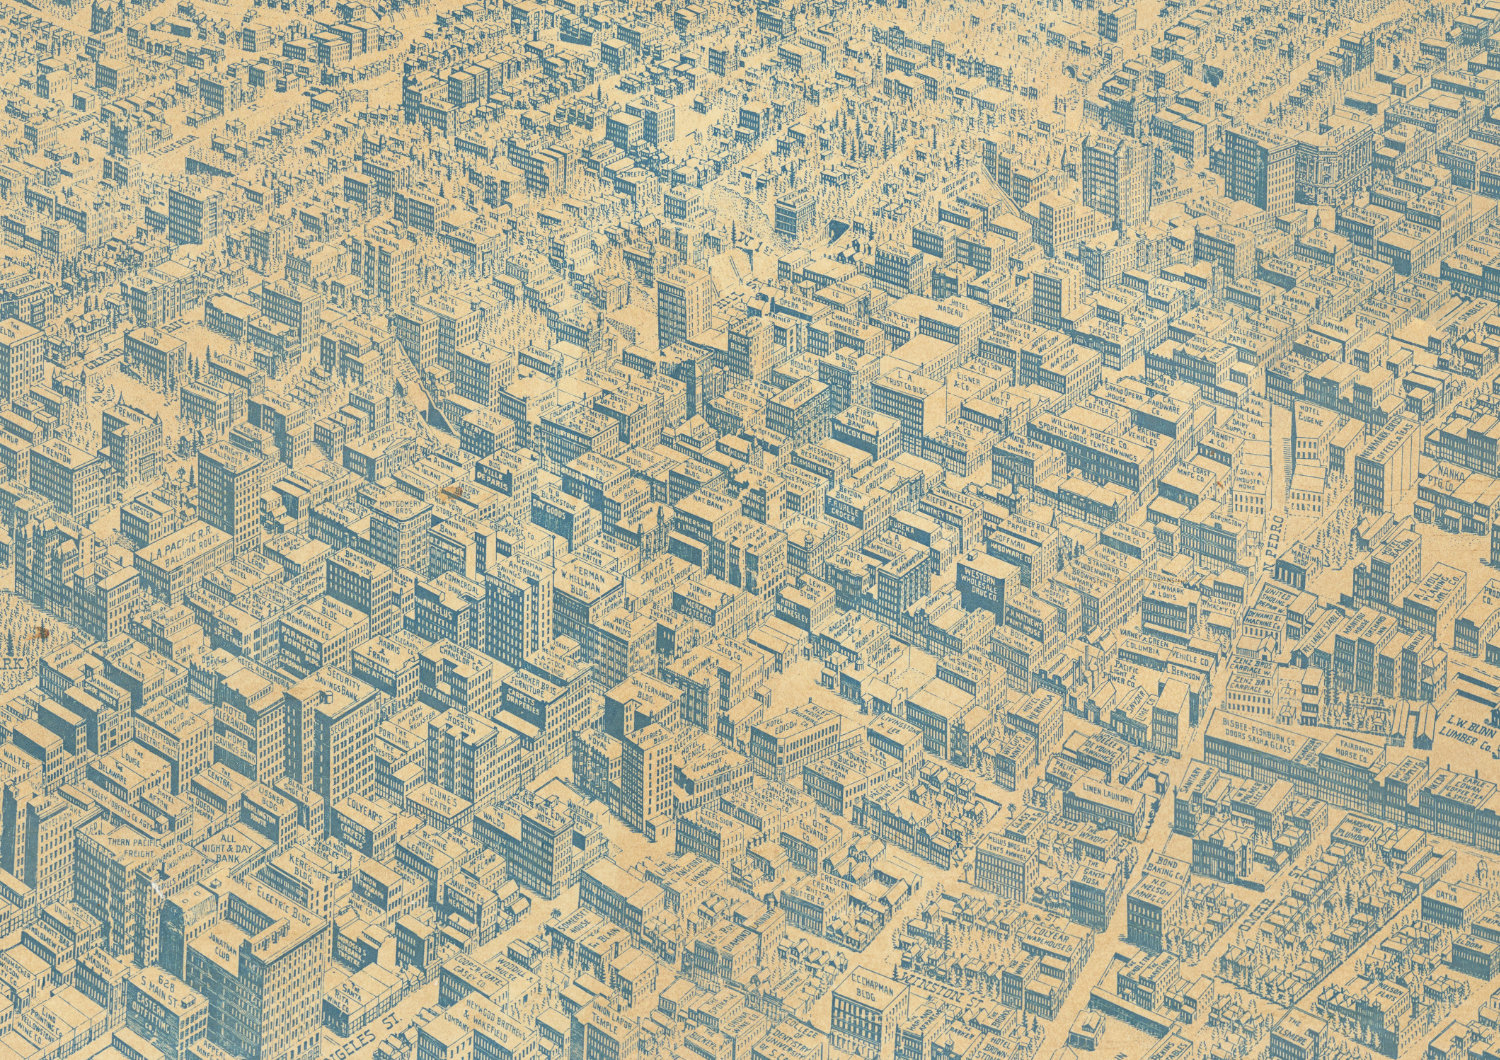
Thesis Topic: Exploring the Challenges and Solutions of Georeferencing Oblique Aerial Views and Architectural Elevations and Sections.
This topic will delve into the process of 3D georeferencing, focusing on oblique aerial views (photographs and drawings) and architectural drawings, such as elevations and cross sections. The research will identify and analyze the problems encountered, such as those related to scale, location, the data model, and assessing the accuracy or uncertainty of results. Furthermore, it will explore the interfaces required for effective georeferencing, viewing, and interacting with these resources. The aim is to provide a comprehensive understanding of the complexities involved and to propose innovative solutions to overcome these challenges.
Links:
- Aerial drawing of Los Angeles (1909) (LAPL)
- Gebouwen en Verdedigingswerken (Nationaal Archief)
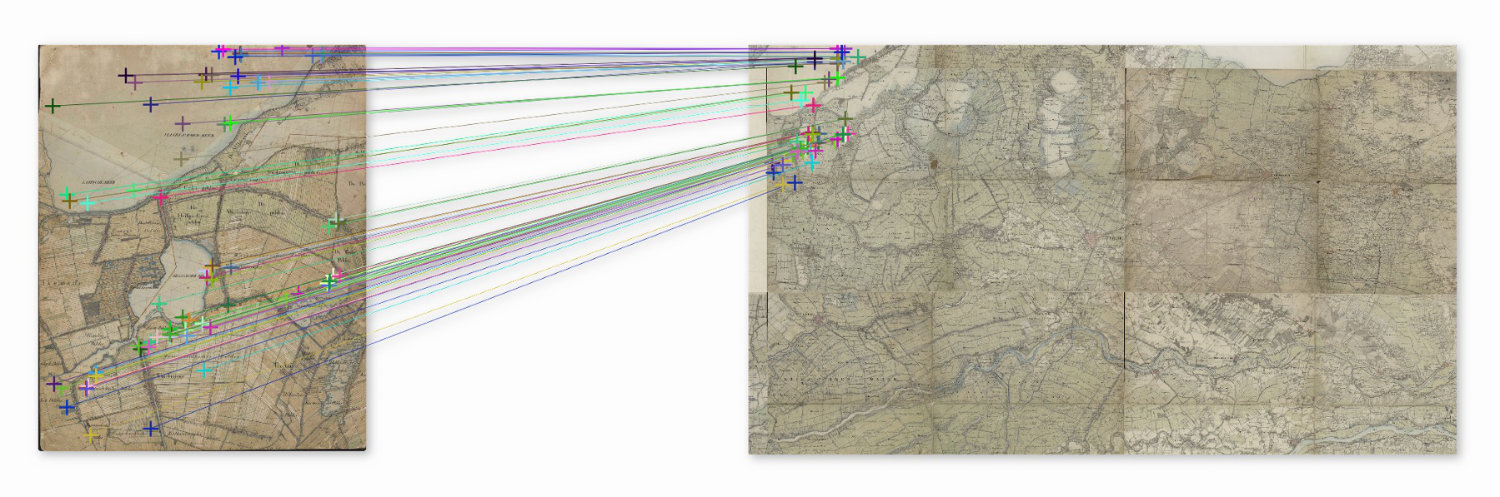
Thesis Topic: Automated Georeferencing of Topographical Map Series: A Machine Learning Approach
This topic will focus on georeferencing various map series held by the Dutch National Archives using machine learning and feature matching techniques. The research will consider different characteristics of the maps, ranging between homogenous layouts and scattered loose sheets. It will also explore the potential of extending the approach to other map series such as those made of the former Dutch colonies. The project will continue and enhance the work done by previous students (Geomatics Synthesis Project) with the ultimate goal to complete the georeferencing of the 4.TOPO archive.
Links:
- Georeferencing Historic Map Series: An Automated Approach (Geomatics Synthesis Project report)
- 4.TOPO Voorlopige inventaris op het kaartenarchief van de Topografische Dienst en rechtsvoorgangers (Nationaal Archief)
Contacts
- Martijn Meijers ( e-mail · staff page )
- Jules Schoonman ( e-mail · staff page )
Keywords
3D, Artificial Intelligence, Georeferencing, Geoweb, Historical maps, Imagery, Standardisation
An xJSON format for ISO 19152 LADM implementation 🔗
Description
As an international standard, the ISO 19152 LADM may stimulate and accelerate the implementation of land administration systems. The LADM is already utilized in various applications and implementations worldwide, usually through the elaboration to a country profile (e.g. UML application schema), and the realization of this profile with a physical (technical) model suitable for implementation: a database schema (Data Definition Language --DDL-- schema of an intended database), a data exchange format (GML,GeoJSON , RDF) and a user interface for edit and dissemination. The LADM is currently under revision and, in addition to the extension of the various parts of the conceptual model defined in Edition I, attention is paid on the steps towards implementations. In addition to the conceptual model, the intention is that Part 6 - LADM Edition II will also include the corresponding technical models (CityGML, InfraGML, RDF, INTERLIS, BIM/IFC, GeoJSON). In this regard, and as JSON formats are gaining ground, it is expected that the multipart Edition II of LADM can be directly implemented in xJSON files to be used in webbased applications. Objective: The aim of this MSc this is the development of an xJSON format as an alternative technical encoding for the implementation of ISO19152 LADM supporting both spatial and non-spatial information.
References:
- A. Kara; V. Çağdaş; U. Isikdag; P. van Oosterom; C. Lemmen; E. Stubkjaer. The LADM Valuation Information Model and its application to the Turkey case. Land Use Policy, 104, 2021.
- C. Lemmen; P. van Oosterom; R. Bennett. The land administration domain model. Land Use Policy, 49 (2015), pp. 535-545.
- P. Van Oosterom; A. Kara; E. Kalogianni; A. Shnaidman; A. Indrajit; A. Alattas; C. Lemmen. Joint ISO/TC211 and OGC revision of the LADM: valuation information, spatial planning information, SDG land indicators, refined survey model, links to BIM, support of LA processes, technical encodings, and much more on their way. In: Proceedings of the FIG Working Week 2019, Geospatial Information for a Smarter Life and Environmental Resilience, Hanoi, Vietnam, April 22--26 (2019).
Contacts
- Eftychia Kalogianni ( e-mail · staff page )
Keywords
Land Administration
Assessment of the effect of outdoor climate on cities' heating energy 🔗
Description
Buildings are responsible for about 40% of the national energy use . They are therefore a main target of energy transition policies. The availability of public energy data at Zipcode level 6 all over the Netherlands makes it possible to map geographically the energy use (see for instance http://www.energieinbeeld.nl/). There are large differences between cities and neighborhoods that can partly be explained by socio-economic factors and construction types. Another factor that has not been research extensively yet is the influence of the climate.
Energy models usually use climate data from KNMI meteorological stations. Generally, the station De Bilt is used as reference climate, but other stations can be used as well, and even networks of individual home stations. This thesis should answer the following questions:
- What are the difference between diverse meteorological stations in terms of temperature, wind and humidity?
- To what extend can this differences explain differences in heating energy use at neighborhood/city level?
- Is it possible to use locale weather data sources (e.g. networks of home stations) en does then the explanatory power of weather to explain variations in heating energy use increase?
- Is it possible to produces maps with heating energy use corrected for weather influence?
- Is the usually used Degree Day correction method in agreement with the findings in this research . If not can we propose a better method?
Contacts
- Peter van Oosterom ( e-mail · staff page )
- Laure Itard ( e-mail )
Keywords
Digital Twins, Energy
Cadaster and Madaster 🔗
Description
Background and aim: The built environment is increasingly becoming spatially complex, where shaping and sharing AECOO, spatial and economic data into an efficient data flow represent a challenge. The potential for the reuse of information within the Spatial Development Lifecycle (SDL) is a significant factor in calculating its economic value. Therefore, in the scene of SDL, digital documentation of materials for real estate objects is very important, taking into consideration EC Digital Building Logbooks approach, as well as the international standard ISO 19152:2012 Land Administration Domain Model (LADM). Information stored in materials passports is only useful when it can be used by the relevant actors at the required time, and therefore, need to be integrated into BIM to provide input data for assessments on reversible and circular design .
Research questions: How can materials passport be reused for land administration applications?
Research objective: This research aims to investigate the potential relationship between Cadastre (or 3D Land Administration System in broader sense) and materials passport (Madaster/ cadastre for materials). To reach this aim, the following steps need to be undertaken: 1) Define specific application areas where Cadaster and Madaster synergy could be beneficiary within the SDL. 2) Investigate how Life Cycle Assessment (LCA) Databases can be linked with Land Administration Systems (LAS). 3) Provide an outlook on challenges to be tackled in the future considering the BIM availability and circular economy.
Method: Literature research; Investigate potential application areas; develop and validate creative design solutions; elaboration of a case study.
References:
- Kalogianni, E., van Oosterom, Dimopoulou, E., Lemmen, C., 2020. 3D Land Administration: A review and a future vision in the context of the Spatial Development Lifecycle. ISPRS Int. J. Geo-Inf., 107(9).
- Honic, M., Kovacic, I., Aschenbrenner, P., Ragossnig, A., 2021. Material Passports for the end-of-life stage of buildings: Challenges and potentials. Journal of Cleaner Production 319.
Contacts
- Eftychia Kalogianni ( e-mail · staff page )
Keywords
3D, Land Administration
Change detection using LoD 🔗
Description
Context: High accuracy and easy collection make point clouds an ideal data source for change detection. However, the large data size causes problems for efficient comparison between point clouds, e.g., AHN2 and AHN3. Level of Detail (LoD ), as you have learnt, is an effective technique to address the big data issue. We choose certainLoD depending on the accuracy requirement of the problem: once more details are needed, we employ a lowerLoD . The general rule is of course, using as less points as possible, to achieve high efficiency. However, how the [ LoD influences the accuracy of change detection is unknown. Thus, this project aims at investigating the possibility to adopt aLoD approach to improve change detection on large point clouds.
Objective: Main research question: What can we gain by using LoD for change detection on large point clouds? Sub-research questions 1) What types of changes should be concerned? 2) What features should an optimalLoD have, for change detection? For example, it should be simple to build/compute, yet it can detect as many changes as possible when using same number of points. 3) How doesLoD influence the results of change detection? Proper metrics for evaluation should be proposed first. Technical route is depicted as follows,
You will start from the Octree structure, a widely usedLoD structure. First go through the whole process. After understanding the problems, try to improve theLoD strategy adopted. In the end, sound comparison will be conducted and presented to indicate the benefits from theLoD approach. For this project, you do not have to start from scratch, as many open source codes are available.
Contacts
- Peter van Oosterom ( e-mail · staff page )
Keywords
Change detection, Point clouds
Compare solutions for bringing 3D subsurface data on the web (at Geological Survey of the Netherlands) 🔗
Description
Geological Survey of the Netherlands (GDN), part of TNO, has a total of 285 employees working in four departments. As a knowledge partner to the Dutch government, GDN has three main tasks: we collect, manage and provide access to information on the subsurface (information task), we advise governments on the use of the subsurface (consultancy task), and we develop applied knowledge on the subsurface and subsurface-related technology (research task). We employ geologists, physical geographers, engineers and, because of our expertise in data management, relatively many geodata scientists and ICT specialists.
As part of our statutory duties under the Mining Act and the Subsurface Base Registration Act (BRO), GDN collects all kinds of (research) data about the subsurface. We manage these data and make them available via portals such as the BROloket, the DINOloket and NLOG. We also create and disclose digital models -GeoTOP , REGIS and DGM- of the subsurface for various applications, which we disseminate through the same channels.
The demand for information from our users - the government and engineering firms - is increasing and particularly for an easily accessible access to 3D models. Soon models in the BRO beingGeoTOP , REGIS and point data such as cone penetration tests and groundwater wells with positions will be available nationwide as ESRI Indexed 3D Scene Layer (I3S ). We realize that there are more developments in the field of 3D online visualizations. With this research we want to compare different standards/implementations. Think aboutCityGML /JSON, Cesium 3D tiles and applying them in for example the Unity platform.
Note: because the documentation of the underground information is mainly available in Dutch, a good command of the Dutch language is required.
- [1] http://www.geologischedienst.nl
- [2] https://www.tno.nl/en/focus-areas/energy-transition/roadmaps/sustainable-subsurface/geological-survey-of-the-netherlands/
- [3] https://broloket.nl
- [4] https://www.dinoloket.nl/en
- [5] https://www.nlog.nl/en
- [6] https://www.dinoloket.nl/detaillering-van-de-bovenste-lagen-met-geotop
- [7] https://www.dinoloket.nl/regis-ii-het-hydrogeologische-model
- [8] https://www.dinoloket.nl/digitaal-geologisch-model-dgm
Contacts
- Martijn Meijers ( e-mail · staff page )
- Wilfred Visser ( e-mail )
Keywords
Geoweb
Comparing compression techniques for 2.5 and 3D point clouds 🔗
Description
A number of specialized compression techniques exist for storing point clouds: Laszip, Google draco, Esri lerpcc General compression codecs are also available, e.g. when storing point clouds in Apache Parquet format, like Brotli, zstd, snappy, gzip, lzo, brotli, lz4_raw.
Questions that should be central in this research project:
- How well do these different formats compress a) 2.5D surface scans (AHN) and b) 3D indoor point cloud data (e.g. collected with Apple iPad)? Are there differences between how well these types of data sets compress?
- How expensive (CPU run time) is it to compress and uncompress?
- Are open source / royalty free implementations available?
- Compression also is related to how data is ordered and grouped. What sorting / blocking schemes will maximize the compression ratio's
References
- [0] https://www.youtube.com/watch?v=A0s0fVktj6U
- [1] https://cesium.com/blog/2019/02/26/draco-point-clouds/
- [2] https://viewer.pointclouds.nl
- [3] https://www.cs.unc.edu/~isenburg/lastools/download/laszip.pdf
- [4] https://codelabs.developers.google.com/codelabs/draco-3d
- [5] https://github.com/Esri/lepcc
- [6] https://github.com/apache/parquet-format/blob/master/Compression.md
Contacts
- Martijn Meijers ( e-mail · staff page )
- Peter van Oosterom ( e-mail · staff page )
Keywords
Point clouds
Converting segmented point clouds into enriched navigable maps for pedestrians in urban scenarios 🔗
Description
Figure: a) Semantically segmented point clouds; b) an urban map extracted from OSM; c) different spatial granularities of maps extracted from semantically segmented point clouds. In summary, in the last years much effort was made to semantically segment point clouds. However, most of mobility tools for pedestrians are still based on networks created from road centrelines instead of representing sidewalks and pedestrian crossings. Consequently, there is still a need of representing the navigable space for pedestrians in a more accurate way to enable realistic path finding. In the recent years, a few of papers proposed the use of point clouds for updating the navigable network. Some papers propose the direct use of classified point clouds for path finding but this solution is impracticable for urban scenarios. This MSc topic propose the conversion of segmented point clouds into enriched networks enabling path finding for pedestrians in urban scenarios. Students will work on segmenting the navigable space for pedestrians, converting the point clouds into networks with different spatial granularities and attributes, and integrating the result into OSM.
Requirements and skills: programming
Contacts
- Martijn Meijers ( e-mail · staff page )
- Lucía Díaz Vilariño ( e-mail )
Keywords
Point clouds
Design and improvement of self-adaptive 3D structuring elements for mathematical morphology in point clouds 🔗
Description
Context: Many image processing techniques have been adapted in recent years for use in point clouds: region growing, connected components, Convolutional Neural Networks, etc. The mathematical morphology has also been adapted for use in point clouds, although, comparable to image processing, the structuring element in a point cloud is strongly related to orientation and point density. The use of structuring elements with fixed orientations and point densities limits the applicability of mathematical morphology to point clouds with unknown orientations and strong density changes.
Objective: This work aims to design structuring elements that adjust in orientation and local point density to the point cloud in the processes of morphological dilation and erosion. Its application will be tested on real and artificial point clouds to solve problems of detection, segmentation and gap filling. During the whole process it will be very relevant the optimization and parallelization, given the great amount of iterations.
Contacts
- Peter van Oosterom ( e-mail · staff page )
Keywords
Point clouds
Designing a Data Infrastructure for Digital Twin Technology in Energy Management 🔗
Description
Background and Aim
The advancement of Digital Twin technology has significantly broadened the prospects for energy management, particularly within the realm of building operations and energy transition initiatives. A key to unlocking these opportunities is the establishment of a robust data infrastructure capable of managing complex energy-related datasets efficiently. This research project aims to design and implement an advanced data infrastructure that supports an integrated energy model, facilitating enhanced energy management and decision-making processes.
Research Questions
-
What are the key components of a data infrastructure that support effective energy management using Digital Twin technology?
-
How can data and information modeling be optimized to improve energy management in buildings?
-
What role do standardization and integration play in enhancing the functionality and interoperability of digital twins for energy management?
-
How can semantic technologies, including ontologies and knowledge graphs, contribute to more sophisticated data discrimination and integration?
Research Objectives
This research intends to create a sophisticated framework for data infrastructure tailored to energy management through Digital Twin technology, with the following specific objectives:
-
To develop a comprehensive data model that integrates diverse energy datasets, facilitating effective data management and analysis.
-
To implement standardization practices that ensure data integrity and interoperability across different systems and platforms.
-
To explore and incorporate semantic technologies to enhance data discrimination, ensuring accurate information extraction and usage.
-
To construct an ontology-based knowledge graph that supports dynamic data linking and complex query capabilities, improving the insight generation from energy data.
Method
This research will employ a multi-disciplinary approach encompassing a thorough literature review, advanced data modeling, standardization practices, and the implementation of semantic technologies. Initially, a comprehensive review of existing literature on digital twins, data infrastructures, and energy management systems will establish a theoretical foundation. Subsequently, robust data models capable of managing complex energy-related datasets will be developed. These models will be standardized to ensure interoperability across various systems and platforms. Additionally, semantic technologies will be explored and utilized to design ontologies and knowledge graphs, which will support advanced data discrimination and integration. This integrated approach will culminate in the development and testing of a prototype to assess the practical effectiveness and scalability of the proposed data infrastructure in real-world energy management scenarios.
References
- Santhanavanich, T., Padsala, R., Würstle, P., and Coors, V.: THE SPATIAL DATA INFRASTRUCTURE OF AN URBAN DIGITAL TWIN IN THE BUILDING ENERGY DOMAIN USING OGC STANDARDS, ISPRS Ann. Photogramm. Remote Sens. Spatial Inf. Sci., X-4/W2-2022, 249--256, https://doi.org/10.5194/isprs-annals-X-4-W2-2022-249-2022, 2022.
- Bjørnskov, J. and M. Jradi, An ontology-based innovative energy modeling framework for scalable and adaptable building digital twins. Energy and Buildings, 2023. 292: p. 113146.
- Zhang, X., et al., Digital twin for accelerating sustainability in positive energy district: A review of simulation tools and applications. Frontiers in Sustainable Cities, 2021. 3: p. 663269.
Contacts
- Amin Jalilzadeh ( e-mail · staff page )
- Peter van Oosterom ( e-mail · staff page )
- Wilko Quak ( e-mail · staff page )
Keywords
Digital Twins, Energy, Knowledge Graphs
Detecting building element/material through ground-based thermal imagery using Deep Neural Networks approach 🔗
Description
Identifying and analyzing the elements/materials used in construction supports promoting sustainable practices in the building industry. This process aims to enhance the lifecycle of materials by facilitating their reuse, recycling, and repurposing, thereby minimizing waste and reducing the environmental impact. Utilizing advanced technologies, both sensing technologies and Deep Neural Networks, provides the scope for more accurate and detailed detection of building elements and analysis of building materials. While mainly optical imagery and laser scanning data have been applied in detection of building elements (e.g. windows), the leverage of thermal imagery requires further research. A potential thesis topic is the leverage of close-ranged (ground-based) thermal imagery (using an existing thermal camera) for the detection of building elements (e.g. windows) and materials. Thermal imagery can be acquired with high temporal frequency for (part of) an existing building (e.g. Architecture Faculty building). A Deep Neural Network approach (e.g. (time-dependent) Convolutional Neural Networks) can be applied to the acquired thermal imagery for spatio-temporal analysis to enable the detection of building elements/materials.
Required Skill: Programming
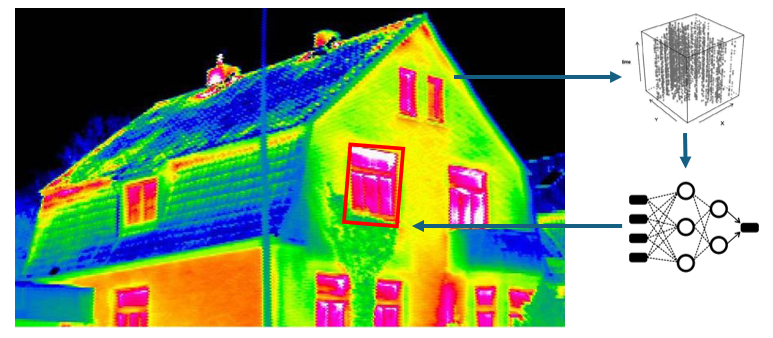
Source: https://carelabz.com/building-envelope-infrared-thermography-inspection-service/
Contacts
- Azarakhsh Rafiee ( e-mail · staff page )
Keywords
Artificial Intelligence, Imagery
Digital Elevation Models (DEMs) using Neural Radiance Fields and your own data - at CGI 🔗
Description
Create Digital Elevation Models (DEMs) using Neural Radiance Fields and your own data. Use previous research at CGI as a starting point to use NeRF for DSM creation and apply it to your own gathered data of the Netherlands (or Egypt). Now most researchers in this field all use the same test dataset by the so called Data Fusion Contest 2019 (DFC2019), but we need to step up and proceed with other data. In this case CGI prefers to choose one or two areas for this research. One will be in the Netherlands and one will be in Egypt. PlanetScope data will be used for this. The research will focus on how to solve data preparation issues automatically. Until now that was a lot of manual work, preventing to use it without the use of pre-prepared data.
Contacts
- Robert Voûte ( e-mail )
Keywords
Artificial Intelligence
Enhancing data reusability in 3D Land Administration Systems in line with ISO 19152 LADM II 🔗
Description
This thesis investigates methodologies to improve the reusability of data in 3D land administration systems (LAS), focusing on the use of LADM as a foundational standard. By leveraging the standards that can facilitate data reuse for land administration purposes, the research aims to develop and validate processes that enhance data interoperability and reusability within land administration.
The current limitations and challenges in the reusability of 3D cadastral data within existing LAS will be identified, focusing on technical challenges, while the refined survey model of ISO19152-2 will be used as basis and the results from the project "3D Cadastral Survey Data Model (3D CSDM)" will be considered. The potential impacts of improved data reusability on the efficiency and accuracy of 3D LAS will be explored, using case studies.
Related references
- https://www.icsm.gov.au/what-we-do/cadastre/3d-cadastral-survey-data-exchange-program
- https://icsm-au.github.io/3d-csdm/
- https://www.gdmc.nl/publications/2024/LUP_LADM_SurveyModel.pdf
- https://www.gdmc.nl/publications/2020/3DLandAdminSDC.pdf
Contacts
- Eftychia Kalogianni ( e-mail · staff page )
- Peter van Oosterom ( e-mail · staff page )
Keywords
Database Management Systems, Land Administration, Standardisation
Enhancing Energy Demand Modeling with Spatial Data: A Geographic Approach to Simulation Accuracy 🔗
Description
Background and Aim: Accurate energy demand modeling is essential for effective energy management and planning, particularly as cities aim to increase energy efficiency and integrate more renewable sources. Current energy demand models primarily utilize data related to meteorological conditions, building specifications, and occupant behaviors. However, these models often overlook the influence of spatial factors --- such as the location of buildings relative to each other, urban density, and the proximity to infrastructural amenities --- which can significantly affect energy usage patterns. This research will focus on integrating and analyzing spatial data within energy demand simulations to improve their predictive accuracy and operational relevance.
Research Questions:
-
How is spatial data currently utilized in energy demand modeling, and what gaps exist in its integration?
-
What specific types of spatial data could enhance the predictive accuracy of energy demand models?
-
What methodologies can be developed to incorporate spatial analytics into energy simulation models effectively?
Research Objectives:
The study will:
-
Assess the current integration of spatial data in energy demand modeling, identifying existing limitations and opportunities.
-
Propose a framework for systematically incorporating relevant spatial data (e.g., urban layout, building proximity, infrastructural characteristics) into energy demand simulations.
-
Validate the proposed framework through empirical testing in varied urban environments, measuring improvements in model accuracy and reliability.
Method:
For the methodology, this research will adopt a dual approach to energy demand modeling by integrating both data-driven techniques and EnergyPlus models, enhanced through the incorporation of spatial data. he study will start with a comprehensive review of existing energy demand models to identify how spatial variables are currently used and to pinpoint gaps in data integration. Following the review, a hybrid framework will be developed that employs Geographic Information Systems (GIS) for spatial analysis alongside statistical and machine learning methods for data-driven modeling. This framework will be applied to both historical data and simulations conducted using EnergyPlus, a dynamic building energy simulation tool. The aim is to validate the improved accuracy of energy demand predictions through empirical testing across different urban settings, ensuring that both traditional and innovative modeling approaches benefit from the enhanced input of spatial data. This integrated methodology will allow for a robust comparison of model outputs, ultimately refining predictive capabilities and supporting more sustainable urban energy planning.
Contacts
- Amin Jalilzadeh ( e-mail · staff page )
- Azarakhsh Rafiee ( e-mail · staff page )
Keywords
Energy, Simulation
Evaluating Point Cloud Density and Gaussian Splatting in Virtual Reality for Indoor Wayfinding and IndoorGML Integration 🔗
Description
Indoor wayfinding is a key component of architectural usability, accessibility, and human-centered design. Simulating this process through Virtual Reality (VR) allows researchers and designers to evaluate how users navigate complex indoor environments—such as hospitals, airports, and universities—without the constraints of physical testing. With recent advances in 3D spatial data acquisition, point cloud representations have gained popularity for their ability to generate highly realistic digital environments using technologies like LiDAR. However, challenges remain in maintaining visual clarity and realism while ensuring computational efficiency, especially when used in VR simulations. One emerging technique addressing this challenge is 3D Gaussian Splatting (3DGS). Unlike traditional mesh-based or voxel-based rendering, Gaussian Splatting renders 3D environments using anisotropic Gaussian ellipsoids. This method provides photorealistic visualization with smooth edges and high-speed rendering, making it particularly well-suited for immersive applications where both realism and performance are crucial (Kerbl et al., 2023). In parallel, the adoption of IndoorGML, an OGC standard for indoor spatial information modeling, offers a structured semantic framework for representing building interiors—using nodes, edges, cells, and spatial layers. Aligning visual environments with IndoorGML semantics is increasingly important for navigation, accessibility, and wayfinding system interoperability.
Objective
To evaluate the impact of point cloud density and 3D Gaussian Splatting rendering on the usability and realism of indoor VR wayfinding environments, and to examine how such environments support visual and conceptual alignment with IndoorGML spatial constructs.
Research questions
- How do different point cloud densities affect the visual quality and usability of VR-based indoor wayfinding simulations?
- To what extent can Gaussian Splatting enhance point cloud visualization in VR, particularly for spatial features relevant to wayfinding (e.g., walls, corridors, landmarks)?
- How well do IndoorGML components (e.g., rooms, edges, paths) correspond with visual and structural elements in Gaussian Splatting-enhanced point cloud VR environments?
Context and Significance
Point cloud VR environments are becoming more viable due to advances in both data acquisition and real-time rendering techniques. Studies have demonstrated that even basic point clouds can simulate real-world conditions for emergency navigation or spatial cognition research (Yasar et al., 2024). However, dense point clouds can become computationally heavy and visually fragmented at lower resolutions. Gaussian Splatting introduces a new approach to rendering such environments—improving surface smoothness, lighting realism, and performance without the overhead of complex meshing. These qualities directly benefit wayfinding simulation, where participants must perceive and react to subtle spatial cues. When used in combination with IndoorGML, which emphasizes semantic spatial relationships (like cell-to-cell movement through doors and corridors), this approach may offer a practical and scalable solution for both research and application development in indoor navigation, accessibility planning, and emergency response simulation.


Key References
- Kerbl, B., et al. (2023). 3D Gaussian Splatting for Real-Time Radiance Field Rendering. ACM TOG, 42(4). https://doi.org/10.1145/3592433
- Yasar, A. M., et al. (2024). Direct Use of Indoor Point Clouds for Path Planning and Navigation Exploration in Emergency Situations. https://doi.org/10.5194/isprs-archives-XLVIII-4-W11-2024-175-2024
- Michalas, M., et al. (2024). Explorative Point Cloud Virtual Reality: Immersive Visual Insight.
- Yu, Y., et al. (2025). 3D Gaussian Splatting for Modern Architectural Heritage. OSF. https://doi.org/10.17605/OSF.IO/P3CW7
- OGC IndoorGML 1.1 Standard. https://docs.ogc.org/is/19-011r4/19-011r4.html
- Karimi, H. A. (2015). Indoor Wayfinding and Navigation. CRC Press.
- Newman, M., Gatersleben, B., Wyles, K. J., & Ratcliffe, E. (2022). The use of virtual reality in environment experiences and the importance of realism. Journal of Environmental Psychology, 79, 101733. https://doi.org/10.1016/j.jenvp.2021.101733
- Jamshidi, S., Ensafi, M., & Pati, D. (2020). Wayfinding in Interior Environments: An Integrative Review. Frontiers in Psychology, 11. https://doi.org/10.3389/fpsyg.2020.549628
Contacts
- Edward Verbree ( e-mail · staff page )
Keywords
Gaussian Splatting, Point clouds
Extending AR point clouds to streets 🔗
Description
Context: Point clouds, as the third spatial data type in addition to rasters and vectors, are penetrating into nearly every spatial application. A fantastic part is to visualize them in reality, helping people comprehend the world more. Earlier work of our group demonstrates the possibility to show indoor point clouds in an AR environment, using only a cell phone. With this app, people can try lots of furniture in their rooms. We think the same idea could be applied to the outdoor environment as well, e.g., city planning, change detection, etc, to help professionals and laymen. However, the difference is that outdoor point clouds are usually much larger, which can cause critical issues when rendered on mobile devices. We have developed state-of-the-art continuous Level of Detail (cLoD) techniques, will they be helpful and applicable?
Source: images from Liyao Zhang (left) and the Internet (right)
Objective: The main research question is: What is an optimal cLoD for visualizing large outdoor point clouds on AR platforms? Sub-questions include: 1. What specific applications to consider? For example, adding virtual buildings or even a whole area; show changes occurred when scanning a certain area 2. Which parts need cLoD? Several bottlenecks exist when rendering large point clouds, e.g., data loading, GPU rendering, etc. 3. How to adapt a generic cLoD to an optimal solution, considering applications and bottlenecks? Our group has developed a generic cLoD framework. You can get first impression by using it. With your understanding of the problem, you will play around to improve the cLoD expression. By programming basic code and testing, such a project can surely be done.
Contacts
- Edward Verbree ( e-mail · staff page )
Keywords
Point clouds
Extracting Maritime Traffic Patterns for Energy Transition 🔗
Description
To create a sustainable world, we must minimize the human effect on producing Green House Gases (GHG). One of the main sources of GHG is transportation. Maritime transportation accounts for 90% of world trade, which presents a big opportunity for improvement. Energy Transition in the maritime sector can help achieve this improvement. However, this transition requires detailed and structured strategic and operational planning. Analyzing the present energy usage of vessels can help achieve this planning.
The energy usage of vessels depends on many parameters that come from different sources. Some parameters must be collected on board while others can be gathered from vessel's navigational information which can be reached from AIS data. AIS is a sequential point data broadcasted by vessels with varying frequency (2 seconds -- 10 minutes) depending on the manoeuvre characteristics of the vessels and message type. Some navigational features include Latitude, Longitude, Speed Over Ground (SOG), Course Over Ground (COG), MMSI (Maritime Mobile Service Identity). Besides, vessel information such as Size (Length Over All - LOA, Beam), Type and MMSI can also be gathered from AIS data. Analyzing AIS data for each ship's movement is computationally intensive and requires a proper spatial-temporal data organization for the purpose of the analysis.
Patterns along the routes extracted via geospatial analysis can be used for energy usage. To evaluate the energy demand of vessels, geospatial analysis focuses on the points where significant changes are observed in navigational characteristics. These points are called waypoints. There are three main techniques for waypoint analysis, each with its advantages and disadvantages:
- Point clustering: The waypoints in the close vicinity are clustered and a network is created.
- Trajectory clustering / Line segment: The line segments between the waypoints are clustered.
- Route clustering: The route choices of the vessels are clustered as a whole.
In this project, you will research the possibilities for:
- The spatial-temporal organization of the AIS data
- Deciding on the best pattern extraction technique (which can also be a combination of them)
- Finding out parameters and the patterns for the energy demand of vessels along the route
- Calculating the energy demand with the outputs of pattern analysis
Machine learning algorithms may help in the extraction process and the outputs should be selected for hind-casting energy consumption of the vessels or energy demand along the routes. Throughout this study, the use of external databases for vessel engine type and size is highly recommended for increasing the accuracy of the energy demand prediction.
References
- De Vries, G. K. D., & Van Someren, M. (2012). Machine learning for vessel trajectories using compression, alignments and domain knowledge. Expert Systems with Applications, 39(18), 13426-13439. 10.1016/j.eswa.2012.05.060
- Whall, C. et al (2010). UK Ship Emissions Inventory, Final Report, Entec, 2010 pdf
- Jana Seep and Jan Vahrenhold (2021). K-Means for Semantically Enriched Trajectories, DOI: 10.1145/3486637.3489495
Contacts
- Martijn Meijers ( e-mail · staff page )
- Yigit Altan ( e-mail )
Keywords
Database Management Systems
From Amsterdam to the World: Conservation Areas in Comparative Perspective 🔗
Description
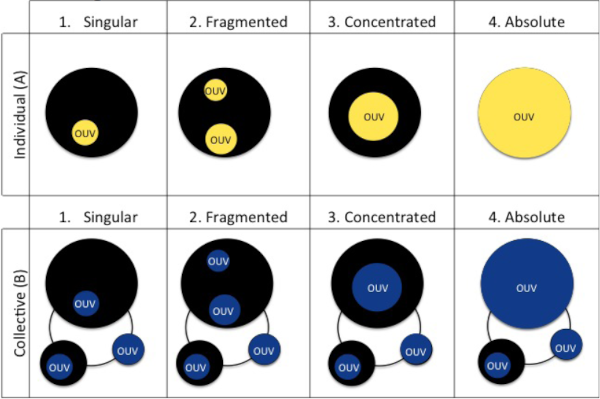
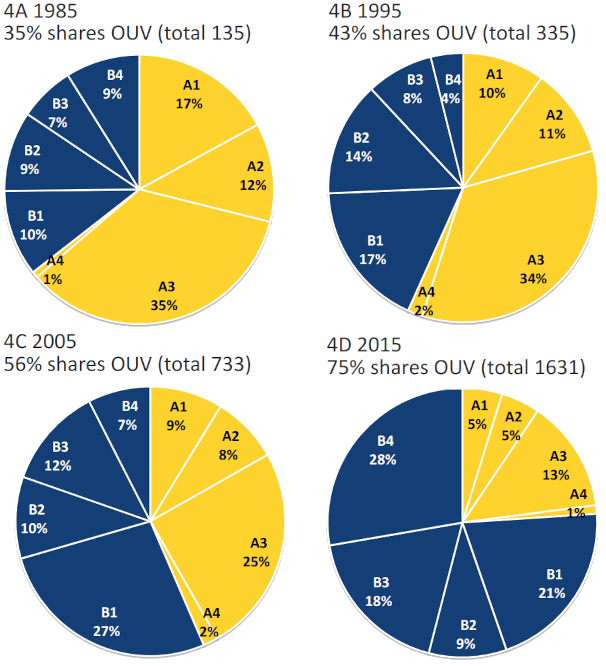
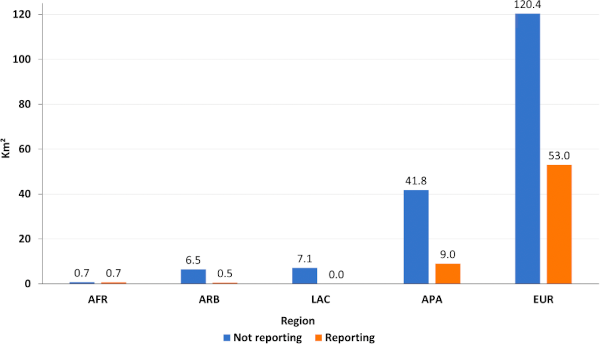
World Heritage cities such as Amsterdam have outstanding universal value, significant both locally and globally. A 2015 global UNESCO survey evidenced that the number of human settlements managing World Heritage has grown exponentially — from 819 in 2009 to 1,631 in 2015, with projections surpassing 2,300 by 2020 — alongside increasingly diverse forms of conservation areas, ranging from single monuments to entire settlements (Pereira Roders et al., 2015). Yet, the relationship between these conservation areas and the wider city remains poorly understood. This topic invites students to analyze the nature of conservation areas in Amsterdam and compare them with one or two other World Heritage Cities, preferably located in other UNESCO regions. The focus will be on their size, content (e.g. building types and ages, green and blue areas, public spaces, and functions), and their relation to the wider city. Analyses will be conducted using GIS-based approaches, combining quantitative (e.g. building age, density, land-use, green/blue ratios, levels of protection) and qualitative (e.g. cultural significance, uses, planning restrictions) methods.
Research methodology
GIS-based mapping and analysis of conservation areas and surrounding urban fabric; comparative typological analysis across selected World Heritage Cities in different UNESCO regions.
Research question
How do conservation areas in Amsterdam and World Heritage Cities in other UNESCO regions compare in terms of size, content, and relation to the wider city?
References
- Pereira Roders, A., et al. (2015). Human Settlements Managing World Heritage. UNESCO.
- Katontoka, M., Noardo, F., Palacios-Lopez, D., Esch, T., Nourian, P., Chen, F., & Pereira Roders, A. (2024). No Report, No Densification? A Spatiotemporal Analysis of Urban Densification and Reporting Practices in World Heritage Properties. Land, 13(1646). https://doi.org/10.3390/land13101646
Contacts
- Ana Pereira Roders ( e-mail · staff page )
- Peter van Oosterom ( e-mail · staff page )
Keywords
Heritage
From low quality point clouds to high quality BIM 🔗
Description
The price reduction of LiDAR technology has allowed its integration into several devices not designed for surveys. This work will explore how the quality of data taken with low-cost devices (iPhone, HoloLens, and other HMLS devices) influences Scan to BIM. The robustness of the algorithms will be assessed considering variations in data quality related to accuracy, density and occlusions.

References:
- Cotella, V. A. (2023). From 3D point clouds to HBIM: application of artificial intelligence in cultural heritage. Automation in Construction, 152, 104936.
- Navares-Vázquez, J. C., Balado, J., Arias, P., & Díaz-Vilariño, L. (2022). Virtual seeds for indoor point cloud segmentation with hololens 2. Available at SSRN 4322378.
Contacts
- Jesús Balado Frías ( e-mail )
- Edward Verbree ( e-mail · staff page )
Keywords
BIM, Digital Twins, Point clouds
Frozen or Evolving? Urban Transformation in World Heritage Cities 🔗
Description
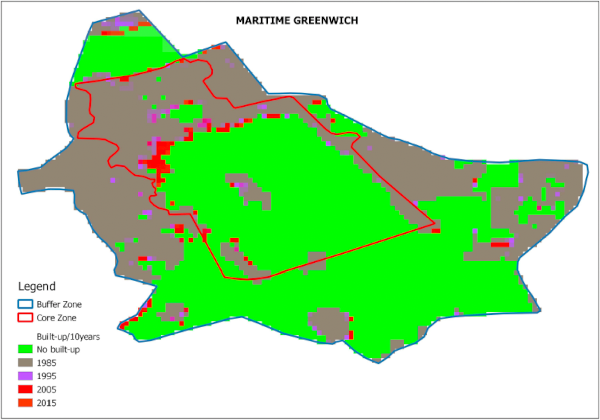
World Heritage is often stereotyped as freezing the city — but does it? In reality, many of the laws and regulations that govern urban development remain the same before and after a World Heritage inscription. This raises the possibility that the “frozen city” label is more a product of political discourse or populism than actual planning practice. Building on recent GIS-based research on urban densification in World Heritage properties (Katontoka et al., 2024), this topic asks students to test this assumption by comparing differences inside and outside conservation areas in Amsterdam and one or two other World Heritage Cities, preferably in other UNESCO regions. The goal is to assess whether conservation areas listed as World Heritage disable urban transformation, or whether they continue to evolve in ways comparable to other urban areas despite their protected status.
Research methodology
GIS-based spatial comparison of transformation patterns inside vs. outside conservation areas; comparative case analysis of Amsterdam and one or two other World Heritage Cities in other UNESCO regions.
Research question
Do conservation areas listed as World Heritage disable urban transformation, or do they continue to evolve in ways comparable to other urban areas?
References
- Pereira Roders, A., et al. (2015). Human Settlements Managing World Heritage. UNESCO.
- Katontoka, M., Noardo, F., Palacios-Lopez, D., Esch, T., Nourian, P., Chen, F., & Pereira Roders, A. (2024). No Report, No Densification? A Spatiotemporal Analysis of Urban Densification and Reporting Practices in World Heritage Properties. Land, 13(1646). https://doi.org/10.3390/land13101646
Contacts
- Ana Pereira Roders ( e-mail · staff page )
- Peter van Oosterom ( e-mail · staff page )
Keywords
Heritage
Geospatial intelligence and mapping support for military operations (at Defensie Expertise Centrum - Dienst Geografie) 🔗
Description

A variety of topics is available in co-operation with the Defence Expertise Centre - Geography Service (in Dutch: Defensie Expertise Centrum - Dienst Geografie, or DGeo). This is a specialized unit within the Dutch Ministry of Defence that provides critical geospatial intelligence and mapping support for military operations. You can read more about DGeo in this interview.
Automating Social Geographic Data
Much development in the field of automated acquisition and image recognition currently focuses on topographic data. There is still room for development in the field of social geographic data. This thesis project involves analyzing the standards of the International Program for Human Geography and developing AI/automation processes to accelerate acquisition. This will be followed by a potential use case for this process.
AI Image/Point Cloud and Object Recognition
Various thesis topics are available in the field of AI image and object recognition. For example, recognition and analysis of objects in point clouds, recognition and plotting of structures and buildings in streetscapes, image recognition, and vectorization of various objects in satellite images.
Automatic Enhancement of Satellite Imagery
Automatically improving the quality and positioning of satellite images using Airbus data (using reference points, super-resolution and other relevant satellite data processing techniques).
Generalization of Vector Data
An international standard is currently being developed for generalizing 1:50,000 vector data to 1:250,000 data. This thesis topic investigates how this development can be supported/improved in the areas of quality control, process description, and technical processes.
Building on various Digital Twin topics
When the potential is recognized, it is possible within the thesis project to further investigate and development of this concept within the concept of military applications.
Other topics
If a student is interested in a graduation assignment at the Ministry of Defence/DGeo but doesn't immediately connect with these topics, an open discussion is also possible to explore their interests.
Contacts
- Peter van Oosterom ( e-mail · staff page )
Keywords
Military
Hierarchical topology structure and viewer in QGIS 🔗
Description
The project aims to investigate possible data structures for storing administrative subdivisions data (e.g. neighbourhood, municipality, province, country borders) consistently. One promising approach is using a 4D (2D space + 1D time + 1D level of detail for the boundaries) topological data structure stored in a DBMS. The subtopics of this project include how such data structure can be edited with QGIS, made consistent over updates over time (e.g. merge of municipalities from year to year) and visualized.
Contacts
- Martijn Meijers ( e-mail · staff page )
- Peter van Oosterom ( e-mail · staff page )
Keywords
Database Management Systems
Identifying blockchain implementation for 3D Land Administration in line with ISO 19152 LADM Edition II 🔗
Description
This thesis will explore the potential of integrating blockchain technology into land administration systems, with a specific focus on aligning this integration with ISO 19152 Land Administration Domain Model (LADM) and specifically ISO19152-6: Implementation. The research aims to develop a blockchain-based framework that enhances the security, transparency, and efficiency of land administration processes. The potential benefits and challenges of using blockchain technology in land administration will be addressed, focusing on the technical challenges, following the investigation of front-runners in this domain.
Contacts
- Eftychia Kalogianni ( e-mail · staff page )
- Peter van Oosterom ( e-mail · staff page )
Keywords
Blockchain, Database Management Systems, Land Administration
Identifying land-related indicators for ISO 19152 LADM Edition II 🔗
Description
The 2030 Agenda for Sustainable Development is a global plan of action for people, planet, prosperity, peace, and partnership. UN member States endorsed the 2030 Agenda and committed to implement the Sustainable Development Goals (SDGs), a set of 17 Global Goals in a 15-year period. Among these goals, some are intricately tied to the realm of land, emphasising the critical importance of effective land management and equitable land distribution for sustainable development. Moreover, the Global Land Indicator Initiative (GLII), seeks to derive a list of globally comparable harmonized land indicators, using existing monitoring mechanisms, and data collection methods as a foundation.
Land administration relates people to land and informs on the 'how', the 'what', the 'who', the 'when' and the 'where' of land tenure, land use, land value, and land development. Land Administration Systems (LAS) are the basis for recording the complex range of rights, restrictions and responsibilities related to people, policies and places. LAS based on ISO 19152 LADM, are key drivers towards a sustainable economy and society and the Edition II of the standard, which is currently under development, will be key component alongside agreed global concepts and evidence-based approaches. Therefore, there is a need for a foundation of a Land Administration Performance Index -- which is a possible link to existing global frameworks or initiatives.
Objective: This MSc thesis will investigate the identification of the ISO 19152 LADM - related SDGs, specifically SDG 1, 2, 11, 14 and 15, provide a formal way to express them within LADM and explore visualisation options (alternatives to visualise them could be: story maps, National Tenure Atlas, etc.). How argets and indicators can be used to assess the added value of adopting 3D Land Administration Systems based on LADM or provide insights if a country does not adopt 3D LAS, will be explored.>
Related literature
- https://www.gdmc.nl/publications/2024/LandLADM_SDG.pdf
- https://www.sciencedirect.com/science/article/abs/pii/S0264837721002222
- https://www.sciencedirect.com/science/article/pii/S0264837723004398
- https://ggim.un.org/meetings/GGIM-committee/10th-Session/documents/E-C.20-2020-29-Add_2-Framework-for-Effective-Land-Administration.pdf
- https://cityfutures.be.unsw.edu.au/cityviz/
- http://web.archive.org/web/20181220224130/https://cloud.google.com/visualize-2030/
Contacts
- Eftychia Kalogianni ( e-mail · staff page )
- Peter van Oosterom ( e-mail · staff page )
Keywords
Database Management Systems, Land Administration, Sustainable Development Goals
Improving Building Performance Prediction through Physics-aware Bayesian Neural Network (BNN) 🔗
Description
The rising occurrence of heatwaves has heightened the demand for precise assessments of building thermal performance in research. Building physics simulations, while widely used to make these estimates, inevitably contain significant uncertainties arising from modeling assumptions, parameter choices, environmental factors and occupant behavior. We are always looking for ways to reduce, or at least quantify, these uncertainties. On the other hand, sensors can gather highly accurate measurements of internal temperatures, but placing sensors in every room of a building might be unfeasible.
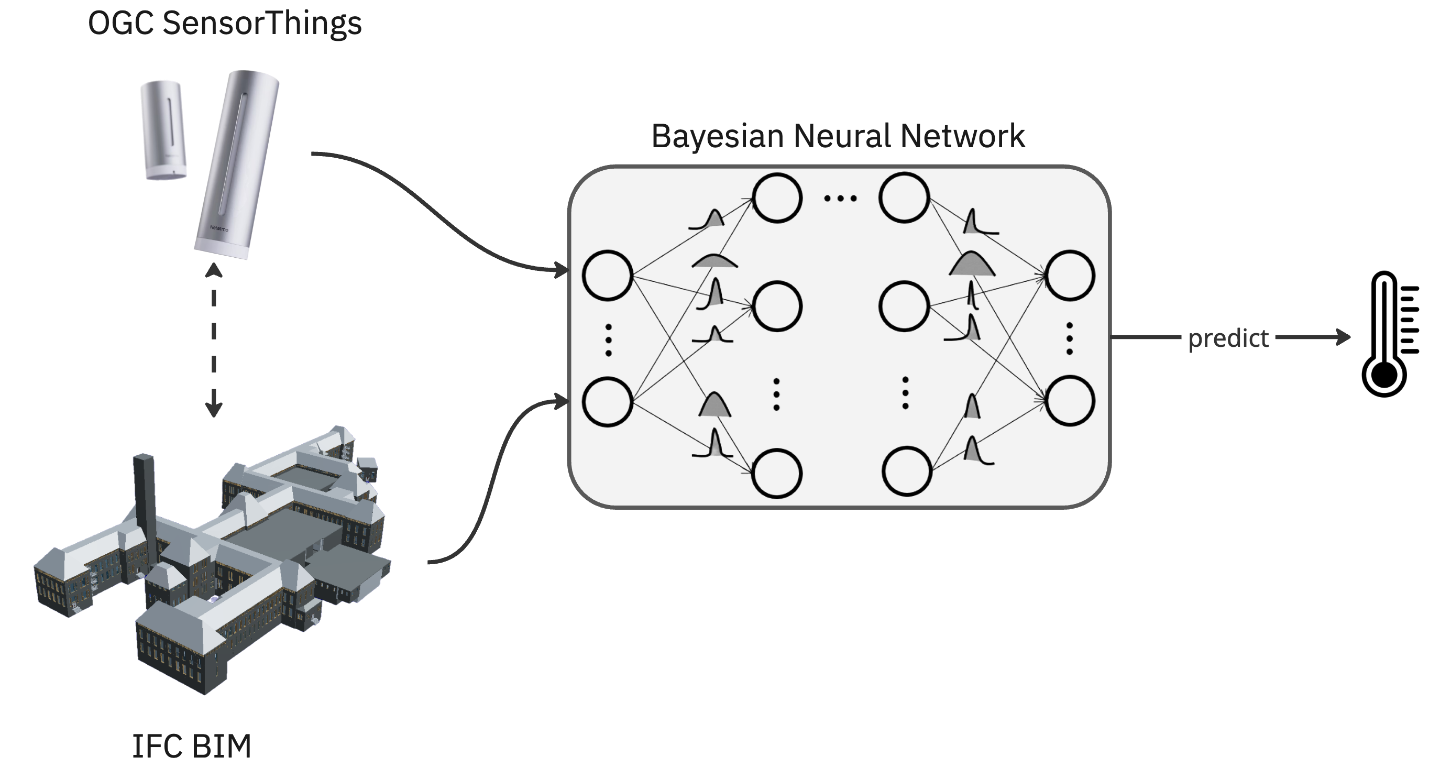
This research proposes that a fusion of physics-driven simulations and sensing technology can lead to better predictions of thermal performance. Using the BK building as a case study, you will use a small network of 10 Netatmo NSW03 sensors. With an existing BIM model of the faculty, you will design a simulation pipeline to predict the internal temperature of various rooms throughout the building. The pipeline will inevitably include uncertainties that might affect internal temperature, such as occupant behavior, (instantaneous) weather conditions, and the central-heating system.
The simulation results, along with other room-specific variables, will be incorporated into a Bayesian Neural Network (BNN). The BNN will initially start with limited amount of data from the sensors, but as more data becomes available, the model's ability to make generalized predictions is expected to improve. At the end of the project, the 10 sensors in the students’ network will be moved to 10 new rooms to validate the BNN model’s generalizability and performance. Finally, the model will then be served online as a web-service.
Research Questions:
-
How can a BIM, building physics model, and sensor observations be efficiently incorporated into a BNN that accurately estimates indoor temperature?
-
To what extent can the uncertainties in building physics simulations be quantified and partitioned by BNNs, and are the results generalizable?
Required Skills:
A reasonable command of a programming language of your choice (Python is a good fit) and interest in Deep Learning, sensor and web technologies.
Contacts
- Azarakhsh Rafiee ( e-mail · staff page )
- Justin Schembri ( e-mail )
Keywords
Geoweb, Simulation
Improving the content of vario-scale maps 🔗
Description
The main goal of this research is to improve the automated generalization process for vario-scale maps at non-fixed levels of detail (stored with the tGAP data structure).
There are lots of possibilities for research and improvement:
- aggregation of non-direct neighbours. A potential algorithm could calculate some neighborhood statistics for each area object. If there are quite some small areas in the same region, and these are of an important feature class, these could be grouped together in one bigger area object, taking into account the areas between;
- better line simplification (with topological consistency amongst feature classes);
- better treatment of linear features (e.g. rivers) versus area features (e.g. cities);
- orchestration of generalization operators (how can expert user define/influence automatic process);
- etc.
A possible starting point for this research is the following paper, that describes some initial ideas for orchestrating the generalization process, but has not yet been implemented so far.
- Martijn Meijers, Peter van Oosterom, Radan Šuba, Dongliang Peng, Towards a scale dependent framework for creating vario-scale maps, Chapter in: ISPRS - International Archives of the Photogrammetry, Remote Sensing and Spatial Information Sciences, Copernicus GmbH , XLII-4, pp. 425-432, 2018. http://www.gdmc.nl/publications/2018/TowardsScaleDependentFrameworkVarioScaleMaps.pdf
Contacts
- Martijn Meijers ( e-mail · staff page )
- Peter van Oosterom ( e-mail · staff page )
Keywords
Vario-scale
Integrating point cloud data sets at multiple epochs: A higher point density and filling occlusions 🔗
Description
The goal of this project is to investigate reliable and verifiable techniques for integrating point cloud data from multiple acquisition moments (epochs) to enhance point density and address gaps in the data caused by the acquisition process (occlusion). This challenge is similar to change detection [2], but also involves identifying obscured areas to create a more complete point cloud representation. One potential solution is to analyze the trajectory of the lidar rays from different epochs using tools likeOctoMap [1]. For this, you need to know the sensor position, next to the points that are measured [3]. A case study using AHN1, 2, 3, 4 and 5 or data collected with our own handheld lidar scanner (Geoslam Zeb Horizon) should be included.
References
- https://link.springer.com/article/10.1007/s10514-012-9321-0
- https://doi.org/10.1016/j.isprsjprs.2023.01.010
- https://eartharxiv.org/repository/view/119/
Contacts
- Martijn Meijers ( e-mail · staff page )
- Edward Verbree ( e-mail · staff page )
Keywords
Point clouds
Integration of point clouds in CityGML standard for obtaining a continuous Level of Detail 🔗
Description
Context: One of the main characteristics of the CityGML standard is the consideration of different Levels of Detail (LoD0 to LoD4 ) [1]. The LoDs allow discrete visualizations of buildings and urban infrastructures. The original five LoDs have been extended with four sub-levels [2]. However, LoDs of CityGML are still far from being considered continuous LoD (cLoD), as in point clouds or maps, where recent works have shown the benefits of cLoD in improving user interactions [3].
Objective: The aim of this work is to study the integration of point cloud geometry in the CityGML standard to obtain a cLoD, similar to the existing in point clouds and reaching at discrete levels the traditional content.
References:
- [1] Gröger, G., & Plümer, L. (2012).CityGML - Interoperable semantic 3D city models. ISPRS Journal of Photogrammetry and Remote Sensing, 71, 12-33.
- [2] Biljecki, F., Ledoux, H., & Stoter, J. (2016). An improved LOD specification for 3D building models. Computers, Environment and Urban Systems, 59, 25-37.
- [3] Zhang, L. (2020). Visualization of Point Clouds in Mobile Augmented Reality using Continuous Level of Detail Method.
- [4] Van Oosterom, P. (2019). From discrete to continuous levels of detail for managing nD‐PointClouds.
Contacts
- Peter van Oosterom ( e-mail · staff page )
- Jesús Balado Frías ( e-mail )
Keywords
Point clouds
Interpreting spoken text to a map (at CGI) 🔗
Description
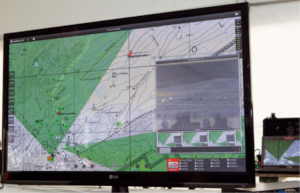
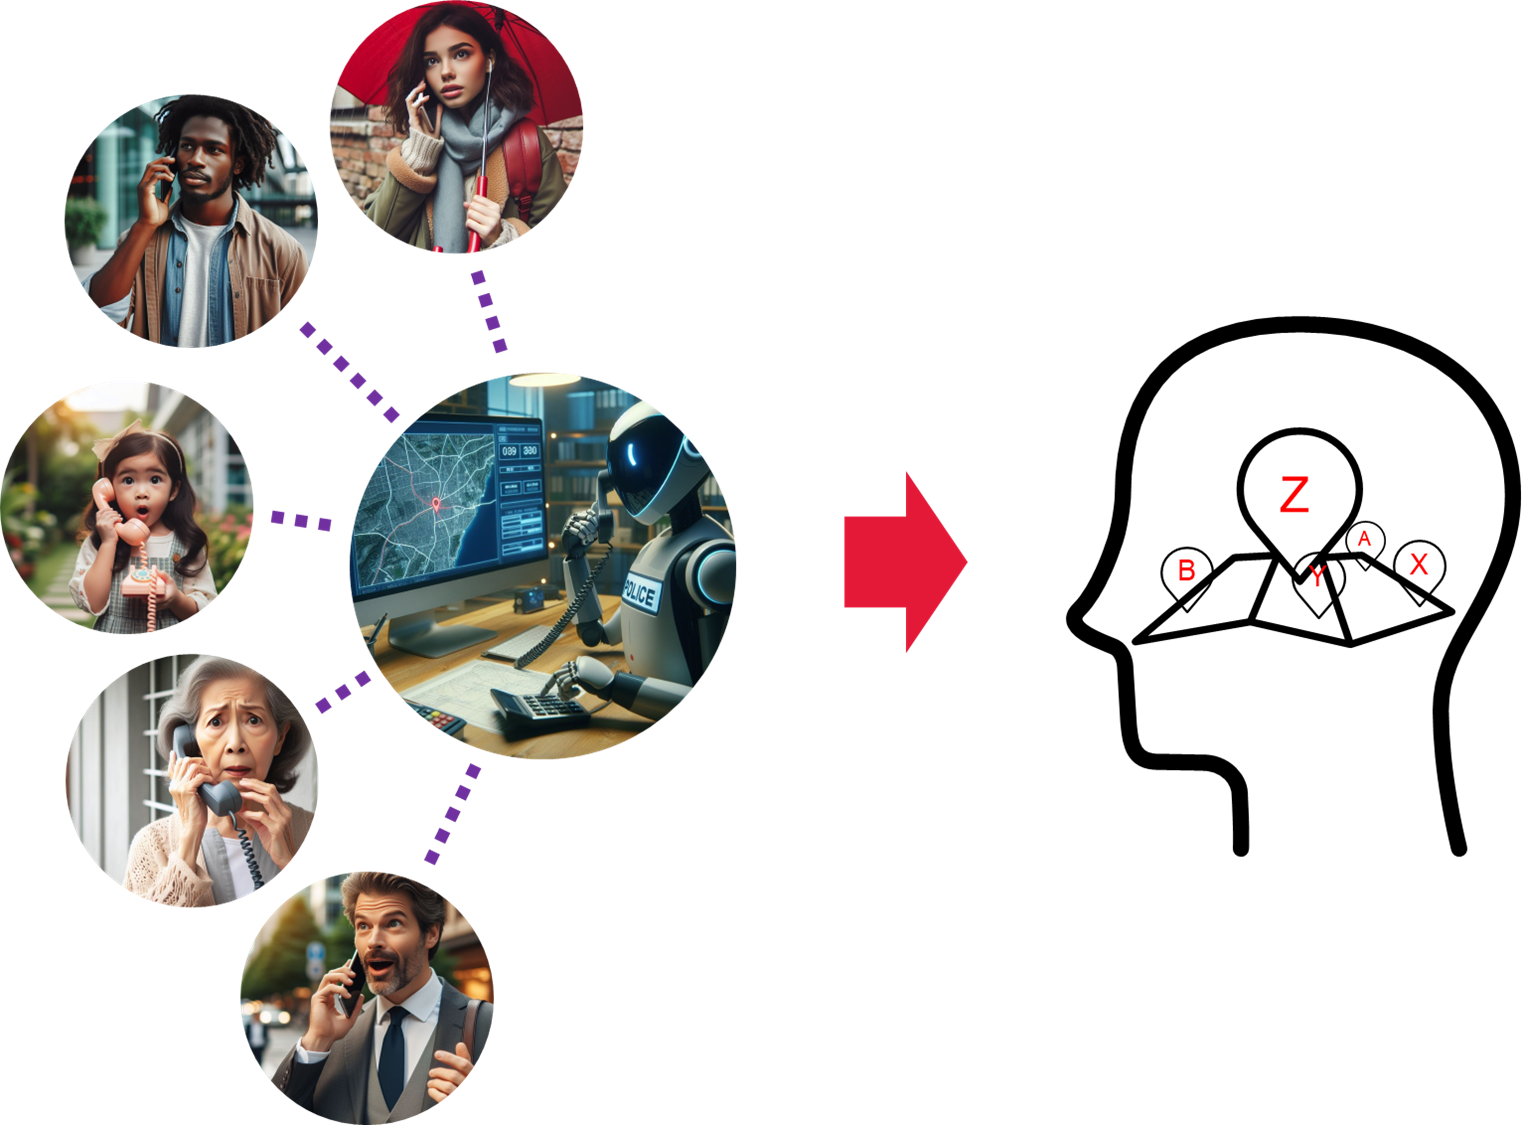
Spoken text can be digitized using Large Language Models (LLM's), like LLAMA. With some additions CGI is capable of finding absolute location pointers in those digital texts. So we can find locations in spoken text. The next step is to interpret these pointers into a map. For that we will also need to find the relative pointers (like "to the right of", "in front of", "opposite of") and directional pointers (like "from A to B"). And all these pointers (absolute and relative) need to be fused into a geographical description (i.e. a map). Some iteration might also be needed here.
The benefits for society are that with a method like this we can interpret messages from ordinary people who communicate with first responders in a geographical way, which makes it much easier for the people in the call center to plan and communicate this plan to their operatives.
What we (CGI Nederland, location Rotterdam) are looking for is a student, that wants to build a first proof of concept of this whole method (extending a first Proof of Concept by CGI). Dealing with the relative and directional pointers is the most difficult part and will need some significant coding to be done. Python can be used and in this first PoC we will stick to 2D. But also a further use of the Speech to Text part for finding a longer list of absolute and relative pointers is needed, so LLM's will also be used (and potentially trained).
References
Wieczorek, J., Guo, Q., & Hijmans, R. (2004). The point-radius method for georeferencing locality descriptions and calculating associated uncertainty. International Journal of Geographical Information Science, 18(8), 745–767.
Contacts
- Robert Voûte ( e-mail )
Keywords
Artificial Intelligence, Georeferencing
Investigating the reliability of indoor objects to act as landmarks 🔗
Description
Landmarks play a critical role in user guidance. Landmarks are used in several cases: 1) to understand current location ( i.e. where I am); 2) to help user distinguish directions ( i.e. where I will head); 3) to confirm user on the right track. At present, the research of navigation landmark for pedestrian focuses on outdoor environments. A landmark could be a high-rise building, a crossing, a signage or any other salient objects to pedestrians. Indoor landmarks are studied in robot navigation. However, there are seldom studies on indoor landmarks for pedestrians.
Indoor landmarks can be a 'coffee machine', a 'picture on the wall', 'plant', etc . If pedestrians are given indoor landmarks, they can easily find their way especially in large halls (convention centres, museums, airports, etc .). Yet indoor landmarks may be distinct to different groups of people (classified by gender, age, height, ability, etc. ).
The goal of this research is investigating and classifying different indoor objects which can be used as landmarks for different types of pedestrians. Some of the research questions will be: "how many user groups can be identified?", "how the landmarks can be organised in 3D indoor navigation models?", "what is the reliability of these landmarks?", "is it possible to obtain these landmarks automatically?".
Contacts
- Edward Verbree ( e-mail · staff page )
Labeling vario-scale maps 🔗
Description
Icons and text are an important part of every map. Symbols and labels have not been implemented in the automated generalization process for vario-scale maps. Placing labels is a classical cartography problem: Each object that has to be labeled allows a number of positions where the corresponding label can be placed. However, each of these label candidates could intersect with label candidates of other objects. Optimization approaches exist that allow to find a solution for just one predefined selected scale, but how can we find the right solution for vario-scale maps? The main goal of this project is answer this and other questing and investigate options how we can produce, store and visualize good labels and icons in vario-scale maps. A student should explore current solutions for label placement in dynamic maps environment such as [4] and Mapbox [5], where the navigation is the main purpose and for symbols and labels is crucial to avoid behaviour that is distracting or jarring such as labels popping or moving about in unexpected ways [2]. Possible research directions: Will the labels be placed on the static map retrieved from the vario-scale structure? For example, the map is created one slice of smooth tGAP structure and labels are added additionally on the fly similar to [3]? Or will the labels be encoded in the structure? E.g. every object in the structure should have the label placed in its area. The size of a label could be defined by the boundaries of the area objects. This idea originates from [1] and it can result in a situation depicted in the figure below.
Using and testing with real GIS data is an essential part of the thesis. A result should preferably also be integrated into the builder for constructing a vario-scale data structure.
- [1] Been, K. Nollenburg, M. Poon, S-H. Wolff, A. (2010) Optimizing Active Ranges for Consistent Dynamic Map Labeling. Computational Geometry: Theory and Applications, 43(3):312-328
- [2] Been, K.; Daiches, E. & Yap, C. Dynamic Map Labeling IEEE Transactions on Visualization & Computer Graphics, 2006, 12, 773-780
- [3] Schwartges, N.; Haunert, J.; Wolff, A. & Zwiebler, D., Point Labeling with Sliding Labels in Interactive Maps, Connecting a Digital Europe Through Location and Place - International AGILE'2014 Conference, Castellon, Spain, 13-16 June, 2014, 2014, 295-310
- [4] Ertz, Olivier, et al. "PAL-A cartographic labelling library." FOSS4G 2008 Conference, Cape Town, South Africa, Vol. 17. 2012
- [5] https://www.mapbox.com/blog/placing-labels/
- [6] http://drops.dagstuhl.de/opus/frontdoor.php?source_opus=9336
- [7] Dynamic Label Placement in Practice,PhD Thesis, Nadine Schwartges https://opus.bibliothek.uni-wuerzburg.de/opus4-wuerzburg/frontdoor/deliver/index/docId/11500/file/schwartges_nadine_dynamic_label_placement.pdf
Contacts
- Martijn Meijers ( e-mail · staff page )
- Peter van Oosterom ( e-mail · staff page )
Keywords
Vario-scale
Making a vario-scale 4D point cloud 🔗
Description
Current point cloud visualizations often employ octree structures for managing Levels of Detail. This leads to visible artifacts, while interacting with the point cloud. In this thesis you will investigate to what extent it is possible to add continuous level of detail information as a 4th dimension to the point cloud (i.e. 1 added attribute).
This would mean creating a point cloud with 4 dimensions, and then using this 4th dimension, while interacting with the point cloud in an interactive way to only display relevant points for the subset of space displayed to the user. A smooth point cloud viewer that runs on the web would be one of the outcomes of this research. Hence, the topic would require a thorough background in, or a strong desire to learn, javascript &WebGL (and related technologies).
Contacts
- Martijn Meijers ( e-mail · staff page )
- Peter van Oosterom ( e-mail · staff page )
Keywords
Point clouds, Vario-scale
Matching the Dutch Cadastral Information Model with the ISO Land Administration Domain Model (at Kadaster) 🔗
Description
The ISO standard for the Land Administration Domain Model has been accepted in 2012, and by now many countries have published their LADM country profile, and several countries also used LADM as basis for the renewal of their information system [1]. The use of LADM is encouraged, by UN-GGIM, UN-Habitat, and the World bank. Currently, the LADM revision process is on-going, based on new requirements from ISO member states. This is resulting in a multi-part Edition II of LADM, covering: land tenure, marine georegulation, land value, and spatial plan information [2]. In parallel the Dutch Cadastral Information Model (IMKAD) has been evolving independently the past decades to serve the needs of the Dutch society [3]. There have been some applications of LADM in Netherlands; e.g. for supporting Cadastral Map Renovation [4], for a Linked-data standards-based portal for integrated Land Administration information [5], and when making a valuation Information Country profile [6]. Note: the information models of all ISO TC211 standards, including LADM (ISO 19152 series), are available from the GitHub page of the Harmonized Model Maintenance Group [7].
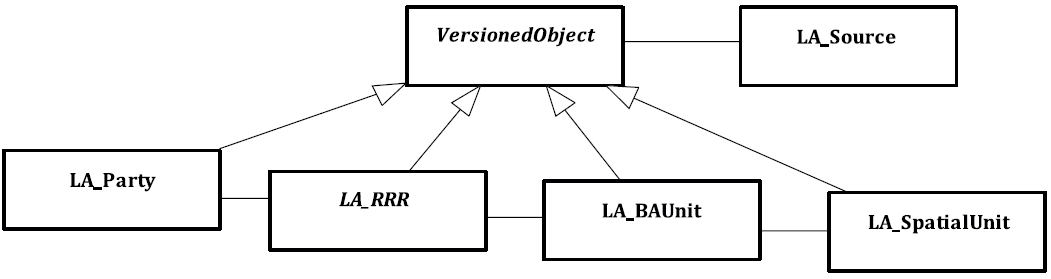
Figure 1 - Simplified representation of the LADM Model
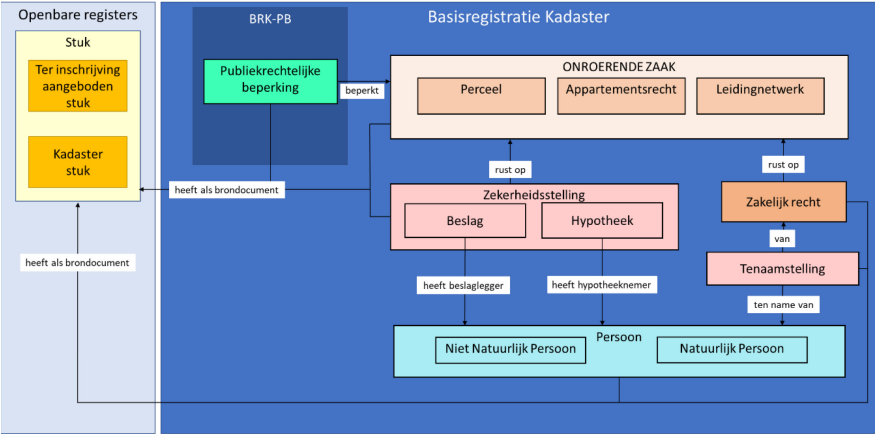
Figure 2 - Simplified representation of the IMKAD Model
It is now a good moment to reflect and compare the two information models. Is the scope/intention of both information models comparable, with LADM Edition II this was extended (marine, valuation and spatial plan information)?, How are the persons/parties, the Rights, Restrictions, and Responsibilities (RRRs) for the various types of spatial units/parcels (land, apartment rights, legals spaces utilities, legal and spatial sources, etc. represented in IMKAD and LADM?, Would the basic administrative unit (property unit), also be valuable for The Netherlands?, What about 2D/3D, geometry/topology, (bi-)temporal aspects (real world vs. database/registration time), versioning (at object or attribute level), etc.? What about group rights, informal rights, community rights, conflicting/overlapping rights (e.g. based on historic proof but in contrast with today's use/registration)? What about the content of the various code list, i.e. the actual code list language?, And last but not least, as the languages are different, how should this be handled?
Research topics
Next to the questions mentioned in the description above, below an initial list of research topics/ question/ aspects to investigate:
- Is it possible to map IMKAD to LADM, and thereby showing compliance of the Dutch mode with LADM (using the Abstract Test Suite as defined in the annex A of the ISO standard)?
- Is it useful to translate LADM to the MIM modelling Language and make use of the supporting code generation tools in de context of implementing the LADM?
- What is functionality (information elements) now in IMKAD, but not in LADM, which could be considered for including in the revision of LADM within ISO?
- What functionality now in LADM is not present in IMKAD, but could be a worthwhile future extension for IMKAD?
- Based on the mapping as mention above, is it possible to also actually automatically convert Dutch data in the ISO standard (similar to converting to INSPIRE compliant representations from Dutch data at DBMS level, or exchange format level)?
References
- [1] Eftychia Kalogianni, Karel Janečka, Mohsen Kalantari, Efi Dimopoulou, Jarosław Bydłosz, Aleksandra Radulović, Nikola Vučić, Dubravka Sladić, Miro Govedarica, Christiaan Lemmen, Peter van Oosterom, Methodology for the development of LADM country profiles, In: Land Use Policy, Elsevier, 105(105380), pp. 1-12, 2021. https://www.gdmc.nl/publications/2021/LUP_CountryProfile.pdf
- [2] Abdullah Kara, Christiaan Lemmen, Peter van Oosterom, Eftychia Kalogianni, Abdullah Alattas, Agung Indrajit, Design of the new structure and capabilities of LADM edition II including 3D aspects, In: Land Use Policy, Elsevier BV, 137, pp. 107003, 2024. https://www.gdmc.nl/publications/2024/LUP_LADM_Ed2.pdf
- [3] IMKAD: Informatiemodel Kadaster, https://www.kadaster.nl/zakelijk/registraties/basisregistraties/informatiemodel-kadaster (in Dutch),
- [4] Eric Hagemans, Eva-Maria Unger, Pieter Soffers, Tom Wortel, Christiaan Lemmen. The new, LADM inspired, data model of the dutch cadastral map, In: Land Use Policy, 117 (2022), 10.1016/j.landusepol.2022.106074 https://www.sciencedirect.com/science/article/pii/S0264837722003143/pdfft?md5=b93d882baa0e2652247f33dfdd3776fe&pid=1-s2.0-S0264837722003143-main.pdf
- [5] Marjolein van Aalst, A standards-based portal for integrated Land Administration information - A case study of the Netherlands, Master's thesis, Geomatics, Delft University of Technology, pp. 243, 2024. https://www.gdmc.nl/publications/2024/MScThesisMarjoleinVanAalst.pdf
- [6] Abdullah Kara, Ruud Kathmann, Peter van Oosterom, Christiaan Lemmen, Ümit Işıkdağ, Towards the Netherlands LADM Valuation Information Model Country Profile, In: Proceedings of the FIG Working Week 2019, Hanoi, Vietnam, pp. 31, 2019. https://www.gdmc.nl/publications/2019/TS08I_kara_kathmann_et_al_10066.pdf
- [7] ISO/TC211 Geographic information/Geomatics, The Harmonized Model Maintenance Group, https://github.com/ISO-TC211/HMMG
Contacts
- Peter van Oosterom ( e-mail · staff page )
Keywords
Data transformation, Land Administration, Model mapping
Mobility of People 🔗
Description
There are loads of datasets with tracks of people collected by GNSS collected by different groups, for example pedestrians in city centres or even more interesting all mobility of people in one week. This research intends to investigate rules for mobility per neighbourhood, i.e. defining a relation between spatial configuration of programme and network, position in the city, position in the region and the actual movement pattern of people (mode, destination). The research should also investigate which other spatial data sets will be needed and connect those to the available mobility data.
Contacts
- Wilko Quak ( e-mail · staff page )
- Stefan van der Spek ( e-mail )
Nationwide geo-referenced repository of BIM/IFC 🔗
Description
Designing and testing an architecture for the exchange of an nationwide geo-referenced repository of of BIM/IFC models, assuming storage in a spatial Database Management Systems and dissemination via web-services (both download and viewing services).
Contacts
- Peter van Oosterom ( e-mail · staff page )
Keywords
BIM
Netatmo Sensor Integration in IFC model of TU Delft Architecture and the Built Environment building 🔗
Description
Monitoring building performance on different aspects, such as temperature, noise and CO2 level is essential for gaining insight on the current situation aiming at improving living conditions on individual building level as well as mitigating environmental problems on larger scales. Through the advancements in Artificial Intelligence, data-driven approaches for building performance monitoring and predictions are being increasingly applied. Various sensors are available and can be integrated in buildings for collecting data on temperature, noise, CO2, humidity, etc. Efficient incorporation of such real-time and historical sensor data into Building Information Models (BIM) supports their usability in various analyses, including the connection to building physical/geometrical properties, for instance in building energy performance analysis. On the other hand, optimal placement of sensors in a building is crucial for exploring the impact of building physical/geometrical properties on its performance (e.g. temperature). This research topic consists of two parts. The first part of the research comprises a research on the optimal placement of the available 7 Netatmo indoor sensors in Architecture and the Built Environment building rooms so that it provides the scope for further research on building performance (e.g. on temperature). The second part of the research focuses on the integration of these (real-time) sensor data (requested through Netatmo API) into a BIM (IFC) model of Architecture and the Built Environment building. Furthermore, the BIM-integrated Netatmo sensor data will be incorporated into a 3D web platform, such as Cesium, wherein real-time and historical data of each room can be visualized. Particular attention should be paid to how the data needs to be stored and which real-time web protocols are available and can be employed for this purpose, like MQTT and websocket.
Contacts
- Azarakhsh Rafiee ( e-mail · staff page )
- Martijn Meijers ( e-mail · staff page )
Keywords
Geoweb
OGC API - Processes for the dissemination of simulation results 🔗
Description
Environmental modelling often requires multiple simulation models and (heterogeneous) data from different sources. Coupling these simulation models and data sources, originating from different tools (and data providers) which follow different protocols can be challenging. A service-oriented approach which provides a standard interface for the interoperability between the different simulation models and their corresponding data sources support a more seamless integration of different simulation models and their incorporation into different systems. OGC API- Processes provides a standard interface for making computational geospatial processing services accessible, via web services. OGC API- Processes leverages the concepts from OGC Web Processing Service (WPS) 2.0 Interface Standard, but is a more modern way of interacting with (computational) resources over web, communicating over a RESTful protocol usingJavaScript Object Notation (JSON) encodings. This research topic can focus on an efficient framework design and implementation of disseminating urban simulation models (e.g. noise, wind) through OGC API -- Processes standard over the web. These simulation models can be visualized in a web client, such as Cesium, containing 3D city models. These 3D city objects will also be applied as input of the simulation models conform OGC API -- Processes standard. Furthermore, the potency of interoperability between the simulation outcome of the involving simulation models can be explored.
Contacts
- Martijn Meijers ( e-mail · staff page )
- Azarakhsh Rafiee ( e-mail · staff page )
Keywords
Geoweb
Optimizing Solar Panel Installations in Urban Districts: A Data-Driven and Digital Twin Integrated Approach 🔗
Description
Background and Aim: In the face of the global shift towards decentralization, decarbonization, and digitalization in energy systems, the importance of solar energy as a key renewable energy source (RES) has become increasingly prominent. This research aims to forge a path for advanced decision-making in urban solar installations by creating realistic planning scenarios that consider sustainability goals and renewable energy uptake. By leveraging data layers, spatial analysis, and optimization algorithms, this project will not only explore the potential for solar energy generation in urban districts but also optimize the siting of installations based on various parameters and energy demands. Additionally, the integration with a web-based digital twin model will enhance visualization and the practical application of findings in real-world settings.
Research Questions:
-
What methodologies can be employed to analyze and enhance the deployment strategy of solar panels in urban districts and buildings using current and historical data?
-
In what ways can optimization algorithms be applied to determine optimal solar panel placements within urban landscapes?
Research Objectives: This research seeks to develop a robust framework for the strategic planning and optimization of solar panel installations in urban areas, which includes:
-
Mapping out current and historical data to identify trends and gaps in solar panel installations.
-
Creating a multi-layered data integration strategy that incorporates energy demand, environmental impacts, urban layout, and infrastructural constraints.
-
Applying advanced optimization algorithms to propose efficient and feasible solar installation scenarios.
-
Integrating research findings with a digital twin model to provide a dynamic, interactive visualization tool that aids in decision-making and scenario testing.
Method:
The methodology encompasses a mix of theoretical research, practical data analysis, and technological application, as follows:
-
Literature Review: Systematic examination of existing literature on solar energy optimization, urban data integration, and digital twin technologies.
-
Data Analysis and Integration: Utilization of GIS and other spatial analysis tools to integrate and analyze urban data layers.
-
Algorithm Development: Design and implementation of optimization algorithms to simulate and identify optimal placement of solar panels.
-
Digital Twin Integration: Development of a web-based digital twin model to visualize and interact with the data and proposed scenarios in a virtual environment.
PS:
Significant progress has already been made in the development of the necessary data and the digital twin model. Assistance with integrating your model into the existing digital twin framework will be provided by Amin. You can view a demo of the digital twin model here: https://dataless.beta.geodan.nl/.
References: [1-4]
- An, Y., et al., Solar energy potential using GIS-based urban residential environmental data: A case study of Shenzhen, China. Sustainable Cities and Society, 2023. 93: p. 104547.
- Gassar, A.A.A. and S.H. Cha, Review of geographic information systems-based rooftop solar photovoltaic potential estimation approaches at urban scales. Applied Energy, 2021. 291: p. 116817.
- Caprari, G., et al., Digital Twin for Urban Planning in the Green Deal Era: A State of the Art and Future Perspectives. Sustainability, 2022. 14(10): p. 6263.
- Narjabadifam, N., et al., Framework for Mapping and Optimizing the Solar Rooftop Potential of Buildings in Urban Systems. Energies, 2022. 15(5): p. 1738.
Contacts
- Amin Jalilzadeh ( e-mail · staff page )
- Azarakhsh Rafiee ( e-mail · staff page )
Keywords
Digital Twins, Energy, Optimization
Patterns of room occupancy in houses and their relation with energy use 🔗
Description
Occupancy behavior and patterns of room usage are believed to influence the energy consumption in homes. Unfortunately, little is known about these behavioral patterns. Our group started a few years ago to build up a database of houses in which occupancy, comfort, temperatures, indoor air quality, gas and electricity use are measured for long periods with a frequency of 10 minutes. At the moment our database contains around 100 houses. This master thesis is about finding patterns of room occupancy at house level and studying possible relationships with energy use. Finding ways for easy-to-read graphical representation will be needed as well. The master thesis is part of the OPSCHALER project, in which a PhD student is also working (www.opschaler.nl). The thesis should answer the following questions:
a) Which combination of datasets (movement sensors, CO2 data) makes it possible to determine the presence in rooms?
b) Which rooms are used all over the day, in which sequences and is there a specific pattern of use in each household?
c) How can this patterns be graphically represented?
d) Is there similarity of patterns throughout the households?
e) Are there correlations between room occupancy and electricity or gas use patterns?
Contacts
- Peter van Oosterom ( e-mail · staff page )
- Laure Itard ( e-mail )
Keywords
Digital Twins, Energy
Photorealistic Visualization of Modern Architectural Heritage Using 3D Gaussian Splatting and UAV-Based Data Acquisition 🔗
Description
Modern architectural heritage, typically built during the interwar and postwar periods, requires effective and scalable documentation methods. Traditional techniques like laser scanning and BIM offer precision but are often costly and resource-intensive (Selim & Ahmed, 2018). Recent developments in computer vision, specifically 3D Gaussian Splatting (3DGS)—present a more efficient alternative. 3DGS renders 3D scenes using Gaussian ellipsoids instead of dense polygonal meshes, enabling photorealistic visualization and real-time interaction with low hardware demands (Kerbl et al., 2023). When combined with UAV-based photogrammetry, 3DGS offers a scalable workflow for capturing, processing, and rendering large-scale heritage structures. UAVs allow fast and flexible image acquisition, especially for hard-to-reach building features (Yu et al., 2025). Compared to alternatives like Neural Radiance Fields (NeRF), which provide highly realistic lighting but are computationally intensive, 3DGS strikes a balance between visual quality and performance (Croce et al., 2024; Bao, Y., et al., 2025).
Objective
To develop and evaluate a 3DGS-based workflow integrated with UAV-based photogrammetry for documenting and visualizing modern architectural heritage. The study aims to test the method’s efficiency, visual fidelity, and potential for interactive use in VR environments.
Research questions
- How does 3DGS compare to SfM and NeRF in terms of visual quality and computational performance for heritage visualization?
- What are the strengths and limitations of using UAV-acquired imagery as input for 3DGS-based workflows in medium-scale architectural sites?
- How effective is 3DGS for immersive, interactive experiences in virtual environments focused on heritage interpretation?


Key References
- Kerbl, B., et al. (2023). 3D Gaussian Splatting for Real-Time Radiance Field Rendering. ACM TOG, 42(4). https://doi.org/10.1145/3592433
- Croce, V., et al. (2024). Comparative Assessment of NeRF and Photogrammetry in Digital Heritage. Remote Sensing, 16(2), 301. https://doi.org/10.3390/rs16020301
- Selim, O., Ahmed, S. (2018). BIM and Architectural Heritage. https://doi.org/10.3311/CCC2018-129
- Yu, Y., et al. (2025). 3D Gaussian Splatting for Modern Architectural Heritage. OSF. https://doi.org/10.17605/OSF.IO/P3CW7
- Bao, Y., et al. (2025). 3D Gaussian Splatting: Survey, Technologies, Challenges, and Opportunities. IEEE Transactions on Circuits and Systems for Video Technology, 1-1. https://doi.org/10.1109/TCSVT.2025.3538684
Contacts
- Edward Verbree ( e-mail · staff page )
Keywords
Gaussian Splatting, Point clouds
Point clouds at The Netherlands' Kadaster (at Kadaster) 🔗
Description
A variety of graduation topics is available at Kadaster.
Topic: Tracking Geo-Object Lifecycles Using Smart Point Clouds
You will research how to use smart point clouds to monitor the lifecycles of geo-objects, while minimizing the risk of false mutations. When volumes are derived from point clouds, each new cloud may show slight differences due to stochastic variation—even if nothing has changed in reality. These fluctuations can lead to inaccurate mutation detections.
- Explore how smart point clouds can be modeled to compare clusters of points directly (instead of derived volumes) for mutation detection.
- Develop a limited proof-of-concept to demonstrate how this approach works.
- Conclude your internship by providing a recommendation based on your findings.
More information (pdf) is available in Dutch.
Topic: Meaningful change detection of dense-matching image point clouds
Topic: Fusion of point cloud dense-matching and AHN, with LiDAR quality enhancement in dense matching
Topic: Is Gaussian splatting of (oblique) aerial photographs possible and what is the accuracy?
Topic: Combining streetscape/LiDAR with aerial photographs/LiDAR (Land Registry, Cyclomedia), Gaussian splatting
Contacts
- Peter van Oosterom ( e-mail · staff page )
Keywords
Gaussian Splatting, Imagery, Land Administration, Point clouds
Positioning and Location Awareness, Point Cloud Cartography or Point Cloud Analysis 🔗
Description
Any topic related to:
- GEO1003 Positioning and Location Awareness
- Point Cloud Cartography
- Point Cloud Analysis
If any of these topics do have your interest, contact Edward Verbree, discuss and agree with him on a topic.
Contacts
- Edward Verbree ( e-mail · staff page )
Keywords
Gaussian Splatting, Point clouds, Positioning, Visualisation
Predictive fetching of geo-web resources 🔗
Description
While browsing interactive maps, data needs to be shipped from server to client for rendering. There exist many standards making this possible, e.g. WMTS, I3S, etc. Most communication schemes for data retrieval are used reactively, meaning that first the user has to carry out a user action like zooming or panning, before data is retrieved. In this project you will study the possibilities for pre-dictive fetching of resources. You should build a model to predict user actions and pro-actively retrieve resources before they are actually needed. The model should be implemented and tested, e.g. by including it into the vario-scale web viewer: https://varioscale.bk.tudelft.nl/gpudemo/2019/12/drenthe/
Relevant literature:
- Martijn Meijers, Peter van Oosterom, Mattijs Driel & Radan Šuba (2020) Web-based dissemination of continuously generalized space-scale cube data for smooth user interaction, International Journal of Cartography, http://www.gdmc.nl/publications/2020/Webbased_dissemination_SSC_data.pdf
- Weber, B. T. (2010) Mobile map browsers: Anticipated user interaction for data pre-fetching (Master's thesis). The University of Maine. https://digitalcommons.library.umaine.edu/etd/551/
Contacts
- Martijn Meijers ( e-mail · staff page )
Keywords
Geoweb
Processing of and managing large volumes of various point cloud data 🔗
Description
Processing of and managing large volumes of point cloud data (some of these topics in collaboration with companies/government agencies).
- AHN1-AHN2-AHN3-AHN4-AHN5 temporal-delta analysis
- Point clouds in the cloud: MS Azure, Amazon, etc
- Data fusion point clouds: combining wet (e.g. river floor) + dry (land) + man-made structures (nat + droog + kunstwerk)
- Cyclomedia PointCloud and Imagery data benchmarking
- GeolinQ PointCloud data management
Contacts
- Peter van Oosterom ( e-mail · staff page )
Keywords
Point clouds
Rights in multi-functional buildings 🔗
Description
Including future ownership and use rights during the design of a (multi-functional) building complex, by enriching the BIM/IFC spaces with legal boundaries, identifiers of legal spaces, and proper georeferencing (design information model, and assess with a number of buildings)
Contacts
- Peter van Oosterom ( e-mail · staff page )
Keywords
Land Administration
Scan2BIM 🔗
Description
Scan2BIM , using laser-scanning, optical imagery enrich the resulting indoor/outdoor pointclouds not only geometrically (georeferencing, continuous levels of detail/importance), but also enrich them semantically by using classifications according to BIM/IFC (i.e. the IFC files use pointclouds only to represent the geometric primitives).
Contacts
- Peter van Oosterom ( e-mail · staff page )
Keywords
BIM, Point clouds
Seabed fingerprinting 🔗
Description
Seabed fingerprinting, how do you store characteristics of the seabed in such a way that you can determine where you are based on this previously stored dataset (fingerprints) using inertial navigation and compass function, even without GNSS.
Contacts
- Robert Voûte ( e-mail )
Securing Critical Seabed Infrastructure using AI on Multibeam Echosounder Data 🔗
Description
As geopolitical tensions rise, the integrity and security of critical seabed infrastructure—such as pipelines and fiber-optic cables—have become a growing concern for NATO and its allies. Continuous monitoring of the seafloor is essential, yet current approaches are labor-intensive and reactive.
This MSc thesis project explores how artificial intelligence (AI) can support the automated analysis and monitoring of seafloor infrastructure using Multibeam Echosounder (MBES) data. MBES delivers detailed 3D point clouds of the seafloor, offering a rich data source for detecting man-made structures, irregularities, or potential sabotage.
A particular focus will be on the feasibility of using deep learning techniques (supervised, semi-supervised, and/or unsupervised) for object recognition, and on how synthetized 3D-objects could support anomaly detection efforts. Additionally, the project may explore how fusion with Side Scan Sonar (SSS) data could enhance detection robustness.
The outcome may include a proof-of-concept data pipeline and model that can enhance the situational awareness of actors tasked with seabed infrastructure protection.
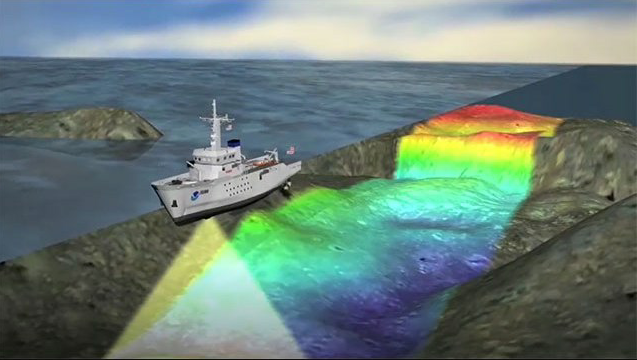
Contacts
- Peter van Oosterom ( e-mail · staff page )
- Vincent Dieduksman ( e-mail )
Keywords
Military
Showing Point Clouds in VR 🔗
Description
A critical issue for massive point clouds rendering in VR lies in the limited memory capacity of the headset. Large scenes built by points are not available unless effective generalization techniques are applied. Besides, extracting points in the view from the database would be expensive if the scene keeps refreshing all the time. This could then influence the smoothness of VR rendering. To address these problems, you will study and develop specific Level of Detail (LoD ) and caching strategies of point clouds that facilitate scene construction in VR. In fact, we have already developed an efficient data structure for point clouds management and querying. You could then integrate novel ideas into it to realize smooth and efficient point clouds rendering. Programming skills are essential for this project.
Contacts
- Martijn Meijers ( e-mail · staff page )
Keywords
Point clouds
Smart Point Clouds of heritage objects 🔗
Description
Creating and dissemination Smart Point Clouds of heritage objects, design the workflow, develop the processing, storage (DBMS), dissemination (Webservices) and visualiaztion (WebGL /WebVR), and test the proposed solution with 2 or 3 case studies.
Contacts
- Peter van Oosterom ( e-mail · staff page )
Keywords
Point clouds
Smart voxels 🔗
Description
Smart voxels, how can you make them represent interior spaces as best as possible, by not seeing the voxels as a representation of a point cloud, but as a representation of the physical boundaries and openings.
Contacts
- Robert Voûte ( e-mail )
Solar envelope zoning in dense urban environment 🔗
Description
Background and aim: The 3D Solar Envelope can be perceived as a tool for urban planning in dense built environment ensuring that adjacent neighbours have a specified minimum direct solar access time per day throughout the year. In this scene, the Solar Envelope Zoning is an approach to solar access protection, originally conceived as a legal framework for city development in the same sense as traditional zoning plans. Given the advances at the 3D city models, parametric CAD environments, digital twins and digital urban planning it is worth exploring how solar envelope can be efficiently defined for dense urban environments in order to used in various phases of the Spatial Development Lifecycle, facilitating its wider use as a prescriptive zoning tool.
Research questions: How can 3D solar envelope be modelled to provide zoning restrictions in the context of the Spatial Development Lifecycle (SDL)?
Research objective: This research aims to investigate how the zoning restrictions from solar envelopes can be modelled in a structured way so that they can be used across various phases of the SDL. To reach this aim, the following steps need to be undertaken: 1) Identify the design methods and digital tools to define solar envelops in 3D. 2) Investigate how the zoning restrictions of those solar envelopes can be modelled according to ISO19152:2012 LADM.
Method: Literature research; Investigate potential application areas; develop and validate creative design solutions; elaboration of a case study.
References:
- Kalogianni, E., van Oosterom, Dimopoulou, E., Lemmen, C., 2020. 3D Land Administration: A review and a future vision in the context of the Spatial Development Lifecycle. ISPRS Int. J. Geo-Inf., 107(9).
- https://www.food4rhino.com/en/app/solar-toolbox
Contacts
- Eftychia Kalogianni ( e-mail · staff page )
Keywords
Land Administration
Spatial constraint modelling (3D geo-OCL, IFC/CityGML / IndoorGML ) 🔗
Description
In this thesis topic you focus on enhancing spatial constraint modeling for built environments using 3D geo-OCL, IFC, CityGML, and IndoorGML. This research aims to develop a robust framework for integrating spatial rules and constraints within heterogeneous data formats, ensuring seamless interoperability between urban-scale and indoor data sets.
Contacts
- Peter van Oosterom ( e-mail · staff page )
Spatial Resolution Enhancement of Thermal Satellite Imagery through Deep Neural Networks 🔗
Description
Thermal satellite imagery, records the emitted radiation in the Thermal Infrared region of EM spectrum, through which the temperature of objects on the Earth's surface can be measured. Thermal satellite imagery can be used for a wide range of applications, including climate monitoring, environmental studies and urban planning (e.g. in Urban Heat Islands and urban energy efficiency analysis). However, the native spatial resolution of these images is often limited by the sensor's capabilities (i.e. aperture size due to TIR long wavelength nature), leading to coarse and less detailed representations, which limits their application on more detailed scales. Therefore, enhancing spatial resolution of thermal imagery can improve their usability in various studies. Recent developments in Deep Neural Networks (DNN) for imagery spatial resolution enhancement, for instance, super-resolution generative adversarial network (SRGAN), demonstrated their potency. However, the focus lies mainly on optical imagery. In line with this, a potential thesis topic is the research and implementation of a DNN approach (e.g. an SRGAN approach) for the spatial resolution enhancement of thermal satellite imagery. Required Skill: Programming
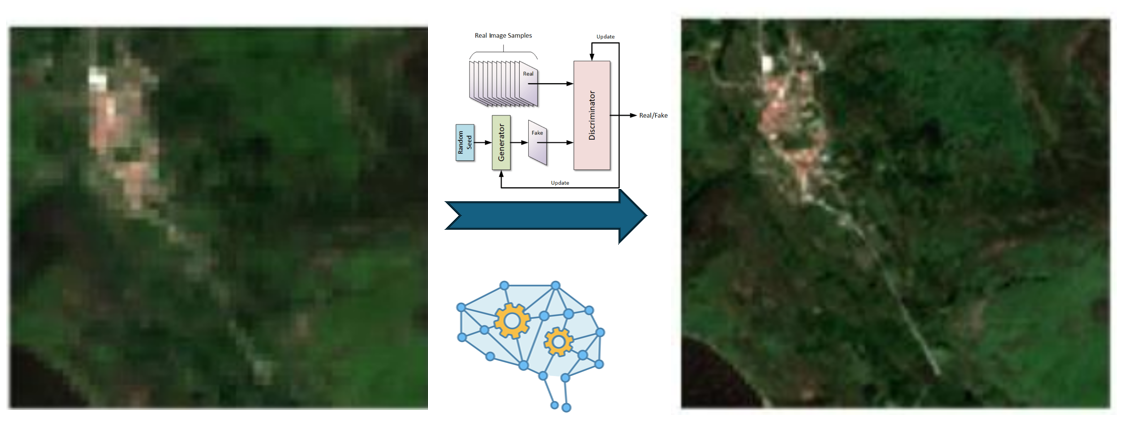
Source: Pham, V. D., & Bui, Q. T. (2021). Spatial resolution enhancement method for Landsat imagery using a Generative Adversarial Network. Remote Sensing Letters, 12(7), 654-665.
Contacts
- Azarakhsh Rafiee ( e-mail · staff page )
Keywords
Artificial Intelligence, Imagery
Storing AIS track logs in a DBMS 🔗
Description
All larger ships (with length greater than 20 meters) are obliged to carry an AIS transponder that transmits their position to nearby ships. There are many applications for which this data may be used. A Database Management System (DBMS) will be needed to serve querying and archiving needs. Because of the amount of data (especially because historic data also needs to be stored), and the real-time nature of the dataset a sound design of a structure inside a DBMS is needed.
In this project you will research the possibilities for building such a system and study one or more of below problems:
- How to handle both real-time questions and questions about historic data?
- Can we reduce the volume of the data for archiving? The ships transmit their locations every few seconds, by removing from the archive intermediate points when a ship is moving in a straight line virtually no information is lost.
- What kind of storage model is needed so that the data can be efficiently queried along multiple dimensions: (1) time (2) location (3) ship id - e.g. can we use Space Filling Curves for this purpose?
For this assignment a rather large archive of AIS messages is available (300GB). You likely will program in Python (or another language of your choice).
- Martijn Meijers, Wilko Quak, Peter van Oosterom, Archiving AIS messages in a Geo-DBMS, In: Proceedings of the 20th AGILE Conference on Geographic Information Science (Arnold Bregt, Tapani Sarjakoski, Ron van Lammeren, Frans Rip, eds.), Wageningen University & Research, pp. 3, 2017. pdf
- Esteban Zimányi, Mahmoud Sakr, and Arthur Lesuisse. 2020. [ MobilityDB : A Mobility Database Based on [ PostgreSQL andPostGIS . ACM Trans. Database Syst. 45, 4, Article 19 (December 2020) DOI: 10.1145/3406534
Contacts
- Martijn Meijers ( e-mail · staff page )
Keywords
Database Management Systems
Straight skeletons for vario-scale maps 🔗
Description
It is known that Straight Skeletons can be used for map generalization [1]. Also it can be used to generate offset curves (buffering) and therefore it seems suitable for erosion/dilation of geometry (first buffering certain distance inwards then same distance outwards hence loosing unimportant parts of shapes). However, the straigt skeleton offers slightly different properties compared to normal buffering operations as implemented in mainstream GISes.
In this project a student should therefore investigate what we can do with the Straight Skeleton as supporting data structure for vario-scale map generalization: how does the operation fit with generating smooth transitions for vario-scale map generalization, for which feature class types is it suitable and how does it compare with other alternative implementations that try to achieve similar goals?
Possible research directions: Can we generate smooth transitions for smooth zooming? Erosion / dilation (what is good order: first in, then out, vice versa, cf. [4]) and how to make these smooth? For which feature class types can this operation be applied, e.g. houses / built-up areas / archipelago / ...?
Investigations with some larger samples of real world geo-data (e.g. BAG panden) is a mandatory part of the project. To get started a student could use either Grassfire [0], which implements Straight Skeleton construction similar to [2], CGAL [3], campskeleton [6] or Surfer2 [7]. For comparison with other approaches one could consider the GEOS buffer operation (as exposed in e.g.PostGIS /Shapely) or using Clipper [5]. A result should preferably also be integrated into the builder for constructing a vario-scale data structure.
- [0] Grassfire
- [1] Area Collapse and Road Centerlines based on Straight Skeletons , Jan-Henrik Haunert, Monika Sester,GeoInformatica , June 2008, Volume 12, Issue 2, pp 169-191
- [2] Computing Straight Skeletons by Means of Kinetic Triangulations , Peter Palfrader, Master's thesis, University of Salzburg, Salzburg, Austria, September 2013
- [3] CGAL
- [4] High Quality Building Generalization by Extending the Morphological Operators , Jonathan Damen, Marc van Kreveld, Bert Spaan
- [5] Clipper - an open source freeware library for clipping and offsetting lines and polygons
- [6] campskeleton
- [7] surfer2
Contacts
- Martijn Meijers ( e-mail · staff page )
Keywords
Vario-scale
Surface reconstruction from ALS point clouds by deriving isocontours 🔗
Description
For many applications (noise, wind and flood simulation models) a water tight surface representation is expected as input. In this project you will research a possible way to derive such a surface.
Starting point is deriving isocontours from an airborne LiDAR scanned point cloud (i.e. AHN3) by using a Delaunay triangulation and the chi-shape algorithm [1] or an alpha shape algorithm. This leads to a stack of polygons (possibly with holes), the iso-contours.
The first objective in the research is to find a way to get from the iso-contours to a surface representation. A starting point could be [2], who employ the straight skeleton to obtain an interpolation of contours, but maybe something simpler based on triangulating 2 related contours will also work. It might be needed to make the relationship between subsequent contours explicit, e.g. by means of a contour tree data structure.
The second objective is to analyse the strengths and weaknesses of this approach, and possibly comparing the obtained surface to other methods to obtain such a surface (e.g. the approach of Zhou and Neumann [3], for which the source is available on github [4]).
Relevant research questions:
- How to obtain a surface from the iso contours?
- What is the effect of chosen parameters for deriving the iso-contours on the resulting surface?
- Can it help to generate a contour tree, for further processing the contours?
- Is it worth simplifying the iso-contours, or is it better to simplify the resulting surface?
- Does it help to use a classified point cloud (building, vegetation, other) as input for deriving the iso-contours?
References:
- [1] Duckham, M., Kulik, L., Worboys, M.F., Galton, A. (2008) Efficient generation of simple polygons for characterizing the shape of a set of points in the plane. Pattern Recognition (41), pp. 3224-3236
- [2] Barequet, G., Goodrich, M. T., Levi-Steiner, A., and Steiner, D. (2004). Contour interpolation by straight skeletons. Graphical Models, 66(4):245--260.
- [3] Qian-Yi Zhou and Ulrich Neumann, 2.5D Dual Contouring: A Robust Approach to Creating Building Models from AerialLiDAR Point Clouds
- [4] https://github.com/qianyizh/UrbanReconstruction
Necessary skills : You will have to program in (at least) Python (and maybe C++) for this topic.
Contacts
- Martijn Meijers ( e-mail · staff page )
Keywords
3D, Point clouds
Taking climate change into account in Land Administration: How to improve and evaluate existing systems 🔗
Description
This study aims to conduct a systematic review of land administration (LA) literature and international guidelines in the context of climate change to identify approaches and methodologies proposed on how LA functions are affected by climate change and how LA should respond to the challenges. It will also explore how current LA information management systems can be improved to support responsive land administration in the context of climate change. Considering the results of the research, an evaluation framework (or index) can be developed to assess climate change resilient land administration systems. The current study also aims to explore how the results of this research can be integrated into the Land Administration Domain Model (LADM).
Relevant literature:
- Fairlie, K., 2023. Land Administration for Climate Change in Practice: Developing a Research Agenda. FIG Working Week 2023, Protecting Our World, Conquering New Frontiers, Orlando, Florida, USA, 28 May – 1 June 2023
- Mitchell, D., & Zevenbergen, J. (2011). Toward land administration systems to support climate change mitigation payments. Land Tenure Journal.
- Quan, J., & Dyer, N. (2008). Climate change and land tenure: The implications of climate change for land tenure and land policy (Land Tenure Working Paper 2).
- Enemark, S., McLaren, R., & Lemmen, C. (2021). Fit-for-Purpose Land Administration—Providing Secure Land Rights at Scale. Land, 10(9), 972.
- Mitchell, D., Enemark, S., & Van der Molen, P. (2015). Climate resilient urban development: Why responsible land governance is important. Land Use Policy, 48, 190-198.
Contacts
- Abdullah Kara ( e-mail · staff page )
- Peter van Oosterom ( e-mail · staff page )
Keywords
Climate change, Database Management Systems, Land Administration
Temporal point clouds to detect weathering of walls 🔗
Description
Various processes, including salt weathering, frost damage, sulfation, are all process which manifest themselves at the surface of the material of building walls and cause discoloration, soiling, loss of cohesion and/or adhesion, resulting in surface recession. Please find below some pictures showing example of damage to a brick and stone masonry due to weathering. In order to take timely action, it is omportant to monitor this type of decay in time. As mentioned, this damage takes from months to years to develop in the field, but it can be accelerated in laboratory.
Contacts
- Peter van Oosterom ( e-mail · staff page )
- Barbara Lubelli ( e-mail )
Keywords
Point clouds
Using Foreign Data Wrappers in PostgreSQL/PostGIS to expose large point clouds stored on the file system as LAZ files. 🔗
Description
It's an advantage to store LiDAR data into a Geographic Database Management System (Geo-DBMS) as this brings the possiblity of easily combining the LiDAR data with other types of geographic data, see e.g. [3]. In PostgreSQL a mechanism exists, called: Foreign Data Wrappers (FDW). "Foreign data wrappers (FDW for short) allow developers to expose external sources of data as tables inside PostgreSQL." [2] Oslandia has made an initial implementation for storing point clouds (but is not yet supporting .LAZ files) [4, 5]. The goal of this project is to make the .LAZ files from the AHN dataset available in PostreSQL/PostGIS by means of Foreign Data Wrappers and report on the benefits/problems encountered while doing so (compared to loading/copying the points into the database).
This work can extend the earlier work of Mutian Deng, e.g. by making an implementation using PGRX or https://supabase.github.io/wrappers/.
References
- [1] https://wiki.postgresql.org/wiki/Foreign_data_wrappers
- [2] https://carto.com/blog/postgres-fdw/
- [3] http://s3.cleverelephant.ca/foss4gna2013-pointcloud.pdf
- [4] https://oslandia.com/en/2017/09/15/pointclouds-in-postgresql-with-foreign-data-wrappers/
- [5] https://github.com/LI3DS/fdw-li3ds
Contacts
- Martijn Meijers ( e-mail · staff page )
- Peter van Oosterom ( e-mail · staff page )
Keywords
Point clouds
Using LiDAR to update a cadastral dataset 🔗
Description
The Queensland Cadastre consists of property boundaries defining the extents of around 2 million land parcels of differing sizes, from small urban lots to many thousands of square kilometres. The positional accuracy is similarly variable. For example, in a rural town, the dimensions of land parcels may be quite accurate, but the absolute positional accuracy of whole town may be significantly in error. The Department is obtaining high density LIDAR data, accompanied by high resolution photography, which may be used to improve the absolute positional accuracy of the Cadastral database (the DCDB), and is interested in the possibility of automatic reconciliation of these data. The aim would be to determine a set of displacement vectors that would place the corners of cadastral parcels in the most appropriate position in relation to the imagery, using identified fence lines and other such features for reference.
More information about the project: http://www.ergon.com.au/community--and--our-network/trees-and-powerlines/roames
Contacts
- Peter van Oosterom ( e-mail · staff page )
Keywords
Point clouds
Visualisation of different types of 3D spatial units 🔗
Description
Dense urbanisation has led to an increasing demand and pressure for land development, resulting in the partition of 3D space into different owners sharing delimited property interests on, above or below the land surface. Consequently, (cadastral) spatial units range from simple, but most common, 2D, to complex 3D collections of spaces worldwide, that are more difficult to handle in terms of surveying, storing in a database, maintaining, visualising, etc. The complexity of volumetric spatial units worldwide is highly variable, namely: condominiums, archaeological sites, mines, pipelines, bridges, marine parcels, air parcels, etc. In order to be used for visualization, the various types for spatial units, should be stored in a format appropriate for downstream use.
An MSc thesis topic could focus on the visualisation of different types of 3D spatial units in a web-based 3D cadastral prototype (previous research can be used as basis; namely: Web-based visualization of 3D cadastre). In this context, pertinent standards in 3D storage and visualization relate to both data format and grammar, implementation as with programming interfaces (API) and Web Feature Services should be explored (many of them are proposed by ISO, OGC andW3C ). Use cases from various types of volumetric spatial units can be used to test the prototype that will be developed.
Related literature :
- Barbara Cemellini (2018). Web-based visualization of 3D cadastre, Master's thesis, Geomatics, Delft University of Technology.
- FIG Publication. Best Practices 3D Cadastres - Extended version (Chapter 5), Editor: Peter van Oosterom, International Federation of Surveyors, Copenhagen, Denmark, March 2018 (ISBN 978-87-92853-64-6, ISSN: 2311-8423)
- Pouliot, J.; Hubert, F.; Wang, C.; Ellul. C. and Rajabifard, A. (2016). 3D Cadastre Visualization: Recent Progress and Future Directions (Overview Report). In: 5th International FIG Workshop on 3D Cadastres, 18-20 October 2016, Athens, Greece.
- Eftychia Kalogianni, Efi Dimopoulou, Rod Thompson, Christiaan Lemmen, Peter van Oosterom. Investigating 3D spatial unit's as basis for refined 3D spatial profiles in the context of LADM revision, In: Proceedings of the 6th International Workshop on 3D Cadastres (Peter van Oosterom, Dirk Dubbeling, eds.), Delft, pp. 177-199, 2018.
Contacts
- Eftychia Kalogianni ( e-mail · staff page )
- Peter van Oosterom ( e-mail · staff page )
Keywords
Land Administration
Visualizing and disseminating property valuation information 🔗
Description
Property valuation is a process of forming an opinion of value of immovable property under certain assumptions. It is performed by public and private sector actors for several LA processes, such as property taxation, compensation on expropriation, land readjustment, land consolidation, insurance assessment, real estate financing, and property transactions. Appropriate systems are required for effectively managing, visualizing and disseminating property valuation related datasets. The Valuation Information Package of ISO 19152 Land Administration Domain Model (LADM) provides a common basis to develop holistic prototype systems for property valuation information.
Objective: The aim of this study is to design and develop an LADM compliant 3D prototype system for visualizing and disseminating property valuation information and creating interactive 3D property valuation maps for the Netherlands.
Relevant literature:
- Kara, A., Çağdaş, V., Isikdag, U., van Oosterom, P., Lemmen, C., & Stubkjaer, E. (2021). The LADM Valuation Information Model and its application to the Turkey case. Land use policy, 104, 105307.
- Kara, A., van Oosterom, P., Çağdaş, V., Işıkdağ, Ü., & Lemmen, C. (2020). 3 Dimensional data research for property valuation in the context of the LADM Valuation Information Model. Land use policy, 98, 104179.
- Lemmen, C. H. J., van Oosterom, P. J., Kara, A., Kalogianni, E., Shnaidman, A., Indrajit, A., & Alattas, A. (2019, October). The scope of LADM revision is shaping-up. In 8th Land Administration Domain Model Workshop 2019.
Contacts
- Abdullah Kara ( e-mail · staff page )
- Peter van Oosterom ( e-mail · staff page )
Keywords
Land Administration
Wind Field Visualization in Game Engine 🔗
Description
Wind simulation plays a crucial role in a wide range of applications. The accurate modeling of wind fields can help in optimizing urban planning and assessing potential risks to pedestrians. The common wind field visualization methods, such as streamlines, vector plots or color maps, either model the field using discretized symbols or model the 3D field using 2D slicing. Volume rendering offers a way to visualize the full 3D scene in detail, but it is known for its high computational cost. This project aims to utilize the parallel computing capabilities of modern game engines to accelerate volume rendering of wind fields.
The first step in this project is to place virtual smoke sources in the wind field and model their propagation. After obtaining the 3D smoke data, volume rendering can be implemented to visualize the smoke field using game engine functionality, making it possible for real-time applications. In order to further decrease the computational cost, additional optimizations, e.g. variant step size, can be applied.
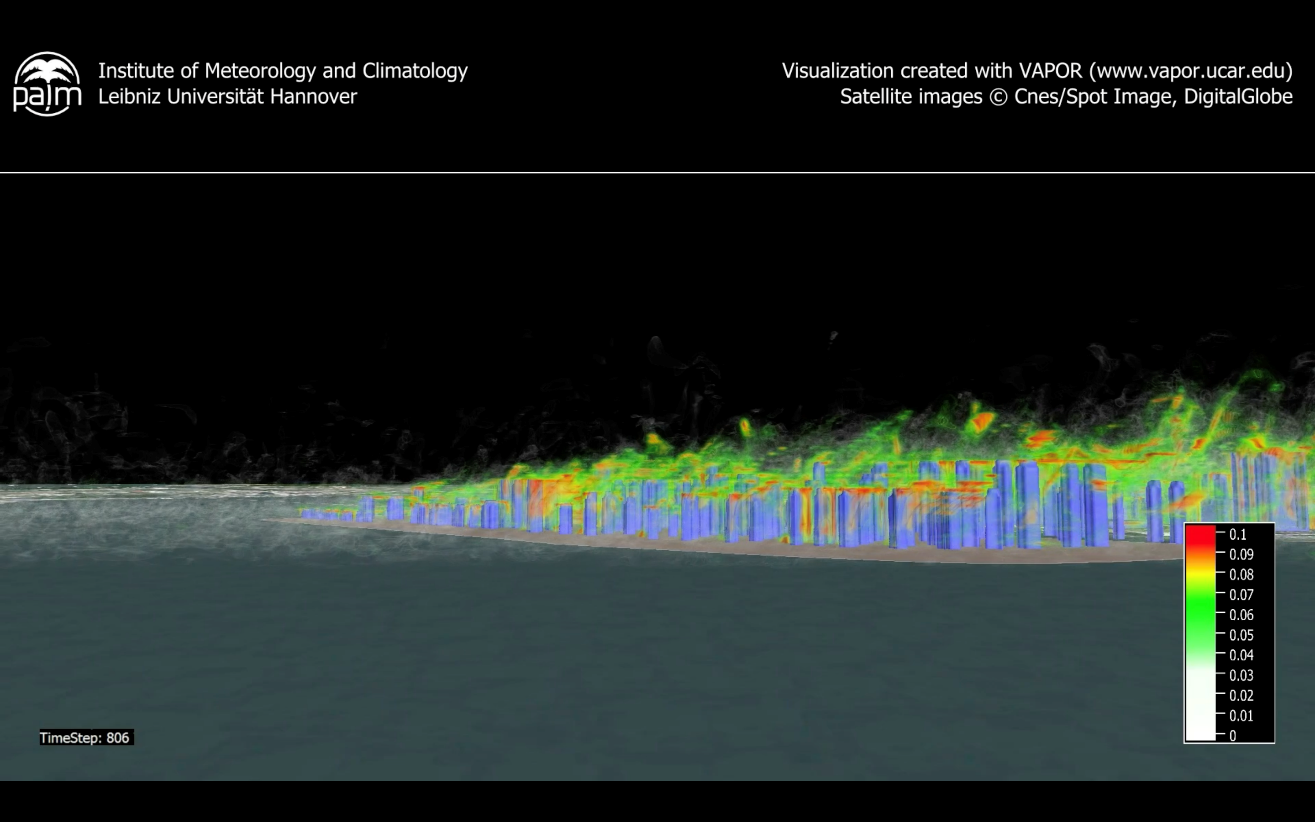
Contacts
- Azarakhsh Rafiee ( e-mail · staff page )
Keywords
Simulation, Visualisation
Zoning plans in 3D 🔗
Description
Covering existing zoning plans into 3D (similar to the Indonesian case of Jakarta and Bandung) and automatically including this in design constraint and checking building permit requests. Based on the obtained experience also guidelines for the direct 3D zoning plans in the future should be developed.
Contacts
- Peter van Oosterom ( e-mail · staff page )
Keywords
Land Administration