|
|
|
|
Interaction in virtual world views - Linking 3D GIS with VR
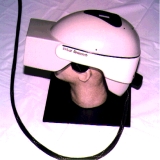
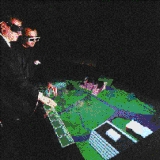
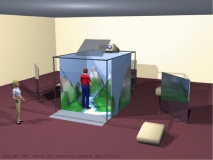
Edward Verbree1, Gert van Maren1, Rick Germs2, Frederik Jansen2 1 Department of GIS TechnologyFaculty of Civil Engineering and Geosciences Delft University of Technology The Netherlands Phone: +31 (0)15 2782795 Fax: +31 (0)15 2782745 2 Department of Technical Mathematics and InformaticsFaculty of Information Technology and Systems Delft University of Technology The Netherlands Phone: +31 (0)15 2782795 Fax: +31 (0)15 2782745 3 International Institute for Aerospace Survey and Earth Sciences (ITC)The Netherlands Phone: +31 (0)53 4874 444 Fax: +31 (0)53 4874 400 Abstract To support 3D GIS interaction within VR-environments we propose a multi-view approach based on three types of visualisation: plan view, model view and world view. The visualisation in these views ranges from a conventional map, through a partly symbolic and simplified 3D representation to a full immersive and photo-realistic 3D display. The views can be used simultaneously or intermittently, and each provides a repertoire of interaction possibilities that are apt -but not necessarily limited- to that view. We are currently developing a 3D GIS&VR system (Karma VI) based on existing GIS and VR technology that uses the three views to support the design, development and presentation of large infrastructure plans in The Netherlands. Operational use of this system showed that the multi-view approach leads to a more sophisticated understanding of those plans. Keywords: 3D GIS, Virtual Reality, Visualisation, and Manipulation Introduction Virtual reality offers new and exiting opportunities to visualise 3D GIS data. Users can walk through 3D environments, see newly planned buildings and appreciate changes in the landscape. In most cases, however, interaction with the data is limited to viewing. At the most there is some restricted form of navigation and interrogation, e.g. the user walks around in the virtual environment and can point to objects in the scene and ask for information from a GIS database. To support more 3D GIS interaction within VR-environments we propose a multi-view approach based on three types of visualisation: plan view, model view and world view. The ‘plan view’ visualises the data as a conventional map. The ‘model view’ provides a 3D bird-eye’s view on a partly symbolic and simplified 3D representation of the data. The ‘world view’ gives a full immersive and photo-realistic 3D display. These views can be used simultaneously or intermittently, and each provides a repertoire of interaction possibilities that is appropriate -but not necessarily limited- to that view. Interaction can be distinguished into orientation and navigation, selection and query, and manipulation and analysis. If the user is immersed in a 3D environment, it is desirable to make this functionality as available as possible. This can be established by making use of the virtual world itself, by offering virtual controls and - if desired - by supporting them by real controls. We are currently developing a 3D GIS&VR system based on existing GIS and VR technology that uses the three views to support the design, development and presentation of large infrastructure plans, such as a new track for a high-speed train. In the following sections, we describe the basic set-up of the system. First we discuss the characteristics of a typical planning application which formulate the requirements of a 3D GIS&VR. This is followed by a brief description of the developments with respect to VR display and interaction techniques. This results in the introduction of the three views and associated analyses and model manipulation techniques with these views. Finally, we describe the system design and implementation strategy. APPLICATION: The Planning Process and the Use of 3D-GIS Before we describe in more detail the linking of VR to 3D-GIS, it is important to know more about the different stages of the planning process of large works concerning the infrastructure. In this way, we can design a system that links up closely with the activities during the planning process. By examining the planning process, performed among several organisations in this sector in The Netherlands, we have been able to distinguish three phases in that process a phase of orientation, a phase of design and modelling, and a phase of presentation and final decision-making. During this three phase process, reality is described from global (small cartographic scale) to (large cartographic scale), and also from 2D to 3D. Each phase knows a different use of GIS. Orientation (Plan Study) During this phase, the problem is studied and all relevant information is collected. After a first analysis of the problem, one or more sketch designs are made on maps with a scale of 1: 10,000 to 1: 100,000. The impact of the design on its environment is analysed by specialists from different disciplines. The different variants are compared and two or three main variants are chosen for further elaboration. The use of GIS in this phase is confined to standard 2D functionality (in a flat country as The Netherlands) for creation and manipulation of geographic entities, and for analyses with respect to the impact on traffic, population, economic parameters, environmental issues, etc. Typical analyses are buffer, overlay, network and proximity. Modelling is limited to symbolic and abstract entities in which the objects are only indicated by position and contour. Visualisation is through 2D maps, tables and diagrams. Design and Modelling In this phase, the two or three remaining alternatives are now elaborated. Buildings and constructions are dimensioned and drawn as 3D objects. The overall shape, however, is still rather simple and not very detailed yet. More important are the size, the dimension, the relation between objects, the general arrangement of objects, etc. Central to this phase is the ability to arrange and manipulate the different components and to analyse their role in the total solution. Visualisation is often done with a 3D scale model. Interaction involves the manipulation and arranging of the objects. Once the general arrangement is set, attention shifts to the technical details and realisation problems. The use of GIS in this phase shifts from 2D to 3D modelling and analysis. Buildings and constructions are modelled with a CAD-system and linked to data in the GIS, and the 3D information is used to calculate volumes, distances, sound contours, shadowing, line-of-sight, etc. Presentation (Decision-making) Once the design has reached the status of a well-engineered proposal, it will be converted into a form to be presented to all participants in the decision-making process. This can be either through detailed drawings, artist’s impressions, CAD renderings, photo-collages, or with very detailed and realistic scale models. The different variants and alternatives will have to be compared and their consequences and performances clearly outlined for each of the different participants (e.g. designers, politicians and citizens). The more realistic the presentation can be, the better the plan is communicated. GIS analyses in this phase involves the impact of the new design on its environment. The design is evaluated with respect to its exploitation, maintenance, usability and environmental quality. Visual analysis is the main task at this stage of the planing process and a more realistic visualisation will only improve the presentation of the plans. Summarising, problems during the existing planning process arise because of lack of 3D functionalities to analyse and visualise the 2D/3D data. To visualise the design and its influence on the surrounding area (2D) maps of the area, sketches of the works concerning the infrastructure, scale-models and animations are used. These visualisation media are static and show a very simple view of the (future) situation. Also, there is little or no interaction between the spectator and the data. From this analysis of the planning process, the most important requirements for the new system are therefore possibilities for 3D analyses, a good visualisation and interaction with the data. The presentation itself is not the final purpose. A solution could clearly be a combination of a 3D GIS with VR Computer graphics techniques have been used widely in GIS (systems) to visualise data and to enhance the interaction of the user with the data. However new developments in virtual reality bring the promise of a much more comprehensive way of interacting with the data: the user is right in the middle of the plan and can directly interact with the 3D data. The basic concept of virtual reality is the direct coupling of the viewing position used to generate the image on the display, with the head position and viewing direction of the user. The head position of the user is constantly tracked and fed into the display algorithm to calculate at each moment a correct stereoscopic and perspective display of the scene. This strong coupling of the current eye position of the user and the image offered by the display system gives the user the illusion of ‘immersiveness’. See figure 1 for different types of VR and Aukstakalnis, &. Blatner, (1992), Earnshaw et al (1993), Burdea and Coiffet (1994) and Kalawsky (1994) for more details. This illusion is in particular created with a head-mounted display (HMD), a helmet with two LCD’s, that effectively isolates the user from the real environment. However, a disadvantage of the HMD is that very powerful computing resources are needed to guarantee the required image update rate (> 20 frames/sec). When the user changes his or her viewing direction, a complete new image has to be generated instantaneously. This strongly limits the complexity of the scene to be displayed. Recently, projective display systems have become available that project the image on a screen or wall (partly) surrounding the viewer. A good example is the CAVE. The CAVE is a cube of 3x3x3 meters with through-projection on three sides and a fourth projection on the floor. The CAVE offers the user a stereoscopic surround projection. The stereoscopy is created by using ‘shutter glasses’ that offers images to the left and the right eye in fast alternation. A tracker registers the head position. In contrast to HMD, no direct image update is needed when the user turns his head. The user just looks in another direction within the projected space, and only the perspective has to be slightly adapted when the user changes position within the projection environment. The frame rate can therefore be lower and scenes that are more complex can be displayed without latency problems (Cruz-Neira et al, 1993).
Fig 1 There are also projection systems that are simpler and less "immersive" than the CAVE. With a single large projection screen, the 3D impression can still be maintained, but there is no surround projection. However, these single- screen projections may be more appropriate for visual presentations to groups. An interesting development is the so-called virtual workbench: a table with projection through the table-top: the 3D image can be visualised on top of the table or inside the table (Krüger et al, 1995). The user is not "immersed" but rather looks from above on the displayed objects. It offers a presentation mode that is normally associated with a 3D-scale model. A very special form of VR is Augmented-Reality (AR), where the user has a full view on the real world, and the computer generated information is superimposed or fused with the real information (e.g., to label objects and buildings and to display information on these objects). AR can be realised with either an optical or a video look-through HMD, and it requires the same fast update rate as the standard HMD. AR is in particular of interest for mobile use. Linking VR to 3D-GIS The linking of a VR-system to a GIS in order to support the planning process of works concerning the infrastructure has to go further than just extracting geometric data from a GIS-database in order to visualise them in a 3D environment (Gruber 1997). Visualisation alone is not enough. The same holds for a 2D-GIS map, which for a planning application is not an aim in itself. In the past, GIS have been used for this purpose, but the various data visualisation possibilities offered by GIS today - not only a maps, but also tables and diagrams - serve as an interface between the user and the system. This visual interaction is of vital importance for the development of a good applicable GIS/VR-system, in which all GIS aspects can be implemented (Kraak et al, 1998). Further discussion of the relation GIS-VR [can be found in Raper et al (1993), Neves et al (1997), Faust (1995) and Rhyne, (1997). Three categories of visual interaction can be distinguished: orientation and navigation, selection and query, and manipulation and analysis. If the user is immersed in a 3D environment, this functionality has to be present in the 3D environment as much as possible. This can be established by making use of the virtual world itself, by offering virtual controls and - if desired - by supporting them by real controls. Orientation and Navigation A user of a GIS/VR-system needs to know where he/she is and where he/she can go. This can be reached via a good identification and interpretation of the virtual world. Besides virtual controls, like a [directional compass, key maps and street maps are useful as well. Real controls are indispensable in this case. Without a 3D-mouse or joystick, moving is unthinkable. Selection and Query During a query of geometric and thematic data and relations (within a study area defined by the user), a virtual world is in fact a virtual representation of the digital landscape model (DLM), matching the one which has been stored in a GIS. Because the user is present within this representation, he/she might not be aware of the fact that a selection or query does not refer to what he/she sees - the digital cartographic model (DCM) - but to the underlying landscape model. Input in the DCM starts a process in the DLM, which gives an output in the DCM. This output has often a more schematic and thematic nature than the input. For selection and query, the user has the same virtual and real controls at his or her disposal as during orientation and navigation. These controls are complemented with the use of a normal PC. It is unfeasible and not desirable to copy or to replace all the possibilities of a combined use of keyboard, mouse and screen by an equivalent in the virtual world. Probably, the use of VR-systems, in which the user is totally isolated from the outside world, like with a ‘head-mounted-display’, should be discouraged Manipulation and Analysis GIS operations, like manipulation of objects present in the real world, performing analyses or modelling the real world, are even more complex than selection and query. Often analysis operations such as those on noise pollution, or line of sight result in numerical values, whereas an visual impression is far more illustrative. A VR-system has the possibility to support these qualitative analyses; the possibility to walk around for fifteen minutes and to request further details in a make-believe world can contribute a lot to the decision-making process. The GIS/VR-system can function as a kind of command-interface to the GIS functionality available and as such offer a certain subset of analysis functions to the user. Combining the three design phases and interaction modes with the different VR visualisation techniques, we derive three modes for the modelling and visualisation, which we will call ‘views’: Plan-view
Model-view World-view
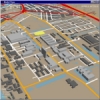
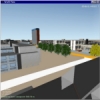
View requirements GIS functionality (i.e. analyses and queries) should also be supported in all views, although each view may have a specific way of interaction to select objects and to specify the query operators. For instance, in the world view, it would be most natural to have the symbolic (alphanumeric) information specified with a spoken-language interface, while in the plan view a more conventional interaction method may provide better user support. Each view will have its own geometric model representation. The plan view will need a 2D symbolic representation of lines, text and pseudo-colours. Buildings are indicated with their contours. Land use is indicated by symbols, texture or colours. The second view, the model view, will have a basic 2-1/2D model representation, such as a TIN (Triangular Irregular Network), possibly with multiple surface layers, to represent the ground level and 3D objects, composed of elementary building blocks to represent houses, buildings and constructions. Finally, the world view will have a very detailed 3D CAD model, enriched with texture maps and procedural models (trees, etc.). Thus, the system will have to support several model representations simultaneously and to provide conversions automatically in case the model is changed in one view and then viewed again in another view. The modelling will also have to support interaction and manipulation of objects through parameterisation, such that objects can be scaled and dimensioned. Further, the model will have to be constrained by geometric relations in order to support the interaction (leave the desired number of degrees of freedom) and to keep the model consistent and to keep objects aligned with each other, e.g. a road with a bridge. The user should further be able to add grouping relations between objects to allow meaningful manipulation of groups of objects. From a performance point of view, it may be necessary to apply Level-Of-Detail (LOD) techniques that automatically adapt the complexity of the geometric model to what can be displayed in real-time, but still looks the same as the full geometry (Fairbairn & Parsley, 1997) . Several techniques are available: the model can be geometrically simplified as a function of the viewing distance (objects that only cover a few pixels can be represented by a few polygons; a large set of small elements can be represented by a transparent volume, etc.), or geometry can partly be replaced by images (the facade of a building with windows, etc. by an image texture, or the complete background by a panoramic picture). Captured video images could also be used to support the ‘augmented reality’ option, for instance through use of QuickTime VR. This would allow the visualisation of new elements within an existing environment that is captured by video and can be replayed as if one moves through this environment. Besides these LOD techniques, adaptive cartographic and conceptual generalisation have to be performed before the data can be used on the different level of detail At the other hand, the system should not only support geometric simplification but also enrichment of the geometric model. It will not always be feasible (or may be too costly) to model a complete realistic-looking environment. Methods will have to be supplied to semi-automatically derive complex and realistic-looking geometry from a limited set of input parameters and general knowledge about how things look (Dutton, 1981) For instance, a procedure could be devised to give the elementary building volumes of the ‘model view’ a realistic ‘town-like’ appearance in the ‘world view’. Houses that have an agricultural function can be displayed as farmhouses, etc. In that respect, the system will have to support both model simplification and model enrichment. Finally, the three views also require different ways to navigate through the data and to interact with the data. The plan-view is very suitable to specifying, selecting, and exploring data. Navigation is implemented through scrolling, panning and zooming or through browsing exploring hypertext links. In the ‘model-view’ relations, constraints, layers and other hierarchical and grouping structures will have to support manipulation and interaction. View point changes and navigation will be steered by real head movements of the user. In the ‘world-view’, navigation will be moving the virtual eye point through the 3D scene. Selection will be done by pointing. Table 1 summarises the properties for each of the views.
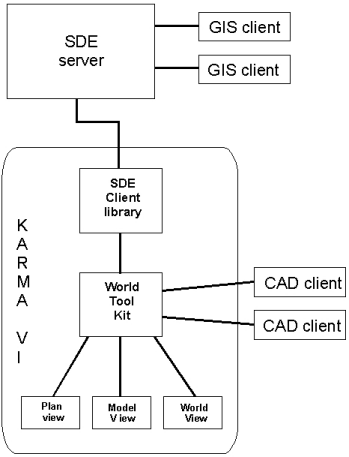
Table 1: properties of the Plan view, Model view and World view System design of karma vi To realize the concept of linked views as described in the previous section, Karma VI is being developed at Delft University of Technology as part of the 3D-GIS&VR project [1], funded by the Dutch Land Water Environment Information Technology (LWI) foundation [3]. Standard GIS, VR and CAD components are used. The major components of the system are the central GIS and the central VR system. For the GIS we have opted for a system that uses one central data server. This way, Karma VI can act as a client on the central data server in a client / server architecture and existing GIS applications can make use of the same data. Furthermore, data consistency and integrity can be better maintained if the spatial and attribute data are stored in one central database. In addition, many users can access the same data simultaneously. We selected the Spatial Data Engine (SDE) [4] form ESRI as the central GIS, and the WorldToolKit from Sense8 [5] as central VR-system. These systems have the advantage of an open development environment and already have a lot of required functionality available. Using these systems, several VR interfaces for a 3D-GIS are being developed to realize the concept of the linked ‘views’ on multiple display systems. If needed, data from other GIS sources will be imported and converted. CAD model data are imported from external CAD-systems and become part of the VR-system. To keep the GIS data consistent with the data in the VR-system, database updates are necessary. The different views and the components of Karma VI are showed in figure 3. As described in the preceding sections, Karma VI uses three types of visualization: Plan view, Model view and World view. In the Plan view, which visualizes the data as a conventional cartographic map, only 2D symbolic representations are required. In the Model view, which provides a 3D bird’s-eye view on the data, simplified 3D representations are necessary. The World view, which gives a full immersive and photo-realistic 3D display, requires 3D CAD models of GIS objects. Each view uses its own geometric model representation of the data stored in the GIS database. With the views all using the same GIS data, consistency between the views is maintained. Karma VI is designed in such a way that it can handle all (2D as well as 2˝D) shape types that can be stored in SDE. The shape coordinates, which are retrieved from SDE, are used to define the WTK geometries for the Plan, Model and (part of the) World view. Shape attribute data are used to correctly generate and/or display 2˝D and 3D geometries.
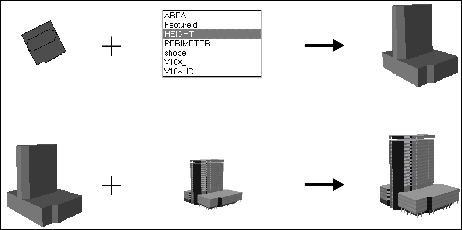
For the Plan view, 2D polygons are created from the 2D shape data. This is a straightforward task for area features. However, since geometries in WTK are built up out of polygons, point and line features have to be converted. Therefore points are represented by small triangles and lines are buffered. In the Model view, these 2D polygons are extruded by one of their attribute values, creating 2˝D geometry. For example, 2D polygons that represent buildings can be extruded by a ‘height’ attribute (figure 4). In the World view, the 2D polygons created for the Plan view, are used to position 3D CAD objects. A ‘height’ attribute is used to define the height of CAD geometry (figure 4). The CAD objects are linked to the original GIS shapes using a separate table in SDE. In this table, the CAD model as well as its orientation and scale parameters are stored.
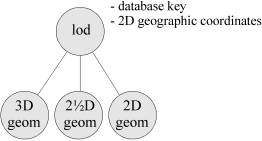
The different geometries needed for the views are stored in a single scene graph. Each shape is represented by a level-of-detail (LOD) node, which is used to cluster the 2D, 2˝D and 3D geometry models (figure 5). The LOD node contains the shape’s database key, and the center of its 2D geographic coordinates. The database key is necessary to enable both Karma and SDE to uniquely identify objects when communicating queries and results. Each of the geometry models is centered at the geographic coordinates stored at the LOD node. When moving one of the models, these coordinates are updated, thereby moving all models in real time. This way, simultaneously displayed views remain consistent at all times.
It is often the case that only a single CAD object is available, which represents multiple shapes in the GIS. Cutting up this object or making independent CAD models for each of the shapes is impractical. Therefore, CAD models can be shared by a number of different shapes. The CAD model is linked to each of these shapes in the database. The model’s center is calculated by averaging the center coordinates stored in the LOD nodes of the shapes. An important feature of the system is the support for manipulation and editing of GIS data from within the VR environment. Within Karma VI, several functions have been developed to be able to manipulate, model or analyze the 2D/2˝D data directly via the different VR interfaces. The actual manipulation, modeling and analyses take place in SDE, while setting manipulation / modeling / analysis parameters takes place in the VR environment. For example, when the user translates and rotates an object in the Model view, only the transformation and rotation parameters are passed to SDE and the actual calculation is performed on the GIS-database. The system will be used on an experimental base within two large infrastructure projects in the Netherlands. One deals with a new railroad station in Utrecht and the other with a new bridge-tunnel combination in the Westerschelde. Its use in these projects will probably lead to an update – adoption of the theoretical approach presented here Development of a 3D GIS & Virtual Reality System has been going on for one year now. Our efforts showed that linking existing GIS and Virtual Reality technology, implementing the multi-view approach is technically possible. The prototype system is operational on PC, Virtual Workbench and the CAVE and allows interaction with GIS-data in a range of virtual world views. Using the multi-view approach, the design, decision making and communication in the process infrastructure design can be supported by an abstract map, a 3D scale model as well as by a very realistic 3D VR scene. In this multi-view environment, the concept of visual interaction is of vital importance. Through this interaction across views and integration with the three phases of the planning process, we can avoid that VR is used only as an (expensive) presentation technique. References Aukstakalnis, S. and D. Blatner, 1992 Silicon Mirage: The Art and Science of Virtual Reality, Peach Pit Press. Burdea, G. and R. coiffet 1994 Virtual reality technology. New YorK: John Wiley. Cruz-Neira, C., Daniel J. Sandin and Thomas A. DeFanti 1993,, Surround-screen Projection-based Virtual Reality: The Design and Implementation of the CAVE, in Computer Graphics, SIGGRAPH '93 Proceedings Dutton, G.H., 1981. Fractal enhancement of cartographic line detail. American Cartographer, 8. ]……Earnshaw, R.A., M.A. Gigante and J. Hones, 1993, Virtual Reality Systems, London: Academic Press Limited. Fairbairn, D. & E. Parsley 1997 …. Faust, N.L. 1995, The virtual reality of GIS. Environment and Planning B: Planning and Design 22, pp. 257-268. Gruber, M., M. Kofler, F. Leberl, 1997, Managing Large 3D Urban Database Contents supporting Phototexture and Levels of Detail, Automatic Extraction of Man-Made Objects from Aerial and Space Images. Kalawsky, R.S., 1994, The Science of Virtual Reality and Virtual Environments, Cambridge: University Press. Kraak, M-J., G. Smets and P. Sidjanin, 1998, Virtual Reality, the New 3D Interface for Geographical Information Systems, to be published in Spatial Multimedia and Virtual Reality, Taylor and Francis. Krüger, W., Bohn, C.-A., Fröhlich, B., Schüth, H., Strauss, W., Wesche, G., 1995, The Responsive Workbench: A Virtual Work Environment, IEEE Computer Society, IEEE Computer, Vol. 28, No. 7, pp 42-48. Neves, N, J.P. Silva, P. Goncalves, J. Muchaxo, J.M. Silva and A. Camara. 1007, Cognitive spaces and metaphors: a solution for interaction with spatial data. Computers and Geosciences 23, no. 4, pp. 483-488. Raper, J., F. McCarthy and D. Livingstone 1993 Interfacing GIS with Virtual Reality technology. Proceedings Association for Geographic Information conference. Birmingham. 3, no. 25, pp.1-4/ Rhyne, T.M. 1997, Going virtual with geographic information and scientific visualization. Computers and Geosciences 23, no. 4, pp. 489-491. HTTP:
|
|
|